Blumberg-serv.bio.uci.edu
TOXICOLOGICAL SCIENCES 67, 219 –231 (2002)Copyright 2002 by the Society of Toxicology
Gene Expression Analysis Reveals Chemical-Specific Profiles Hisham K. Hamadeh,* Pierre R. Bushel,* Supriya Jayadev,† Karla Martin,* Olimpia DiSorbo,† Stella Sieber,* Lee Bennett,* Raymond Tennant*,1 Raymond Stoll,† J. Carl Barrett,* Kerry Blanchard,† Richard S. Paules,* and Cynthia A. Afshari*,1 *National Institute of Environmental Health Sciences, P.O. Box 12233, MD2-04, Research Triangle Park, North Carolina 27709; and †Boehringer-Ingelheim Pharmaceuticals, Inc., Ridgefield, Connecticut 06877 Received November 26, 2001; accepted January 8, 2002 enzymes that regulate metabolism, tend to be frequently mod- The application of gene expression profiling technology to examine
ulated by many compounds, and therefore do not provide a multiple genes and signaling pathways simultaneously promises a
solid footing for providing specificity for distinguishing mul- significant advance in understanding toxic mechanisms to ultimately
tiple classes. Given the universe of compounds available, sig- aid in protection of public health. Public and private efforts in the
natures may only be attained using a higher number of vari- new field of toxicogenomics are focused on populating databases with
gene expression profiles of compounds where toxicological and
ables (i.e., number of genes), where the collective state pathological endpoints are well characterized. The validity and utility
(expression) of these genes would define the profile associated of a toxicogenomics is dependent on whether gene expression profiles
with exposure to that compound. The field of toxicogenomics, that correspond to different chemicals can be distinguished. The
through the use of DNA microarrays, has the potential to principal hypothesis underlying a toxicogenomic or pharmacog-
advance our understanding of how multiple genes are involved enomic strategy is that chemical-specific patterns of altered gene
in responses of biological models to chemical exposure expression will be revealed using high-density microarray analysis of
(Burchiel 2001; Fielden and Zacharewski 2001; Hamadeh et tissues from exposed organisms. Analyses of these patterns should
al., 2001; Nuwaysir et al., 1999; Thomas et al., 2001; Waring allow classification of toxicants and provide important mechanistic
et al., 2001a,b). Instead of monitoring the expression of a few insights. This report provides a verification of this hypothesis. Pat-
genes in response to chemical exposure, DNA microarrays terns of gene expression corresponding to liver tissue derived from
chemically exposed rats revealed similarity in gene expression profiles
enable the study of levels of expression of thousands of genes between animals treated with different agents from a common class
at the mRNA level. The concerted expression pattern across of compounds, peroxisome proliferators [clofibrate (ethyl-p-chloro-
those genes constitutes the expression profile of a compound at a certain dose and time.
pyrimidinylthio]acetic acid), and gemfibrozil (5-2[2,5-dimethyl-
Structurally unrelated compounds may belong to the same phenoxy]2-2-dimethylpentanoic acid)], but a very distinct gene
class of chemicals because of similarity in the pharmacological expression profile was produced using a compound from another
or toxicological endpoints they elicit. For example, at doses of class, enzyme inducers (phenobarbital).
diethylhexylphthalate (DEHP) and Wyeth 14,643 that produce Key Words: gene expression; toxicogenomics; DNA arrays; clas-
similar levels of peroxisome proliferation in rat liver, Wyeth sification; rat liver; pattern recognition.
14,643 produces an earlier and much greater liver tumor re-sponse than does DEHP (Biegel et al., 1992; Melnick et al.,1987).
Numerous approaches are used to investigate the relation- In this study, we tested the hypothesis that structurally ship between chemical exposure, toxicity, and disease states.
unrelated compounds from the same chemical class produce One approach is to study the modulation of gene expression in similar, yet distinguishable, gene expression profiles. We also a biological model in response to chemical exposure. This hypothesized that intraclass profiles are more similar to each modulation represents a signature of the cellular response to other than to profiles corresponding to agents from different the effect of the studied compound. These possible signatures chemical classes. In order to test whether specific patterns of cannot be defined using classical methods where genes are gene expression can be defined for a class of compounds and investigated individually for potential association to chemical whether distinguishable patterns can be discerned within that exposure. This is because the most highly characterized chem- class, we studied the expression profiles of 3 well-studied ical-responsive genes, such as genes encoding proteins or agents belonging to the peroxisome proliferator class of com-pounds [clofibrate (ethyl-p-chlorophenoxyisobutyrate), Wyeth To whom correspondence should be addressed. Fax: (919) 316-4535.
acid) and gemfibrozil (5–2[2,5-dimethylphenoxy]2-2-dimeth- HAMADEH ET AL.
ylpentanoic acid)]. We also studied the expression profile of a measured weekly. Based on the most recently recorded body weights, the well-studied enzyme inducer, phenobarbital, in order to deter- volume of drug administered was adjusted. Animals were observed 2–3 timesdaily for signs of overt toxicity. Experiments were performed according to the mine whether a distinction could be made between it and the guidelines established in the NIH Guide for the Care and Use of Laboratory peroxisome proliferators. Microarray analyses were performed Animals. At the end of the drug phase of the study, each animal was fasted using liver RNA derived from chemically exposed Sprague- overnight before necropsy. Animals were taken to a deep plain of anesthesia Dawley rats at multiple time points of exposure.
with CO2, sacrificed by axillary vessel incision; exsanguination and necropsy This work highlights several important points for the utility immediately followed. A cross section of the left lateral lobe of the liver wascollected in 10% neutral buffered formalin for histopathology. The remaining of toxicogenomics studies. First, the data confirm that com- portions of liver were collected in RNase-free tubes and snap frozen in liquid pound classification based on gene expression profiles is fea- nitrogen. Frozen tissues were stored at –70°C until processed for RNA extrac- sible. In addition, the data illustrate the differences in the gene tion. A control sample was generated by pooling livers of 9 vehicle-treated expression elicited by chemicals that may be related in many aspects but differ with respect to toxicological effects. Further The liver tissues collected in formalin at nec- investigation of these differences might offer an explanation of ropsy were processed, embedded in paraffin, sectioned at 5 microns, andstained with hematoxylin and eosin (H&E). Histopathologic examinations of the dissimilarity in adverse effects associated with various the liver sections were conducted by a pathologist and peer-reviewed.
peroxisome proliferators. In addition, our report also addresses Total RNA was isolated using QIAGEN (Qiagen, Valen- the influence of the time of exposure on gene expression by cia, CA) RNeasy kits. Liver sections of 130 –250 mg were used for midipreps highlighting transient and delayed gene expression events in and liver sections of approximately 800 mg were used for maxipreps. Homog- response to the 2 classes of compounds studied. As toxicog- enization buffer was added to frozen liver sections, and the tissue was imme- enomics databases evolve, these distinctions will be important diately homogenized on ice (tissue did not thaw prior to homogenization) using for understanding mechanisms and developing signatures of a Cyclone homogenizer equipped with a rotor/stator shaft (VirTis Company,Gardiner, NY). Homogenates were processed as per the standard QIAGEN toxicity or adaptation. Finally, the data in this paper provides 3/99 protocol. Final product yielded 260 nm/280 nm ratios of 1.6 –2.0, purity important information on gene expression changes, including was confirmed via gels, and concentration was determined based on 260 nm time-independent changes that may be used to develop signa- tures of the compound classes of peroxisome proliferators.
cDNA microarray hybridization and analysis.
A cDNA NIEHS Rat Chip, Underlying the analyses of these signature genes is the poten- v1.0, developed in-house at NIEHS, was used for gene expression profiling tial to develop hypotheses about the potential mechanism of experiments. A complete listing of the genes on this chip is available at thefollowing Web site: http://dir.niehs.nih.gov/microarray/chips.htm. cDNA mi- action of these agents.
croarray chips were prepared according to DeRisi et al., 1996. The spottedcDNAs were derived from a collection of sequence-verified clones that cov-ered the 3⬘ end of the gene and ranged in size from 500 to 2000 base pairs MATERIALS AND METHODS
(Research Genetics). M13 primers were used to amplify insert cDNAs frompurified plasmid DNA in a 100 l polymerase chain reaction (PCR) mixture.
Animal treatment and sample collection.
Male Sprague-Dawley VAF⫹ A sample of the PCR products (10 l) was separated on 2% agarose gels to albino rats (CRL:CD(SD) BR; Charles River, Kingston, NY) approximately ensure quality of the amplifications. The remaining PCR products were puri- 5–7 weeks old were maintained on certified rodent chow (PMI Feeds, Inc., fied by ethanol precipitation, resuspended in ArrayIt buffer (Telechem, San Brentwood, MO) ad libitum in individual stainless steel wire bottom cages Jose CA) and spotted onto poly-L-lysine-coated glass slides using a modified, suspended on racks. The animals were kept under controlled lighting (12-h robotic DNA arrayer (Beecher Instruments, Bethesda MD).
light-dark cycle), temperature (72° ⫾ 5°F), and humidity (50 ⫾ 20%) and were For microarray hybridizations, each total RNA sample (35–75 g) was acclimated to this environment for 4 –7 days prior to the start of the study.
labeled with Cyanine 3 (Cy3)- or Cyanine 5 (Cy5)-conjugated dUTP (Amer- Healthy rats were randomly assigned to dose groups (3 rats/group) by a sham, Piscataway, NJ) by a reverse transcription reaction using reverse tran- computerized method. For the 2-week studies, a 1-week pretest involved scriptase, SuperScript (Invitrogen, Carlsbad, California), and the primer, Oligo dosing of all animals via oral gavage with 10 ml/kg vehicle. The 24-h studies dT (Amersham, Piscataway, NJ). Control samples were labeled with Cy3 while did not have any pretest period. Clofibrate (CAS # 637– 07– 0), gemfibrozil samples derived from chemically exposed animals were labeled with Cy5. The (CAS # 25812–30 – 0), and phenobarbital (CAS # 57–30 –7) were obtained fluorescently labeled cDNAs were mixed and hybridized simultaneously to the from Sigma (St. Louis, MO); Wyeth 14,643 (CAS # 50892–23– 4) was cDNA microarray chip. Each RNA pair was labeled and hybridized indepen- obtained from ChemSyn Laboratories (Lenexa, KS). Dosing suspensions of all dently in triplicate to a total of 3 arrays. The cDNA chips were scanned with compounds were prepared using a high speed homogenizer, and all dose an Axon Scanner (Axon Instruments, Foster City CA) using independent laser suspensions were continuously stirred until completion of dosing. The perox- excitation of the 2 fluors at 532 and 635 nm wavelengths for the Cy3 and Cy5 isome proliferators (clofibrate, gemfibrozil, and Wyeth 14,643) were prepared using 1% carboxymethylcellulose/0.2% Tween 80 as vehicle and phenobarbi- The raw pixel intensity images were analyzed using the ArraySuite v1.3 tal was prepared using water as vehicle. Drug concentration and identity were extensions of the IPLab image processing software package (Scanalytics, verified via HPLC, as per United States Pharmacopeia (USP) methods for Fairfax, VA). This program uses methods that were developed and previously clofibrate, gemfibrozil, and phenobarbital. For Wyeth 14,643, a Waters 600E described by Chen et al. (1997) to locate targets on the array, measure local HPLC was equipped with a variable wavelength detector set at 235 nm, and a background for each target, and subtract it from the target intensity value, and Symmetry Cs 4.6 ⫻ 250 mm column. Equal portions (approximately 10 ml) of to identify differentially expressed genes using a probability-based method.
standard and test solutions were injected separately into the column. Parame- After pixel intensity determination and background subtraction, the ratio of the ters of the run were as follows: mobile phase, 0.0738 M sodium acetate: intensity of the treated cells to the intensity of the control was calculated. We acetonitrile (55:45 v/v); flow rate, 1 ml/min; column temperature, ambient; and have previously determined that significant autofluorescence of the gene fea- run time, 6 min. The HPLC retention time of Wyeth 14,643 under these tures on the array, attributed to spotting solution, occurs at high scanning parameters was 3.4 ⫾ 0.1 min. Body weights and food consumption were power (Tucker et al., unpublished). We measured the pixel intensity level of GENE EXPRESSION ANALYSIS AND TOXIC MECHANISMS "blank" spots comprised of spotting solution. The data was then filtered to value was defined as the actual PCR cycle when the fluorescence signal provide a cut off at the intensity level just above the blank measurement values increased above the background threshold. Induction or repression of a gene in in order to remove from further analyses those genes having one or more a treated sample relative to control was calculated as follows: Fold increase/ intensity values in the background range. The ratio intensity data from all of decrease ⫽ e – (CT(exposed) – CT(control)). Values were reported as an average of the 1700 spots printed on the NIEHS Rat Chip v1.0 was used to fit a probability distribution to the ratio intensity values and estimate the normalization con-stants (m and c) that this distribution provides. The constant m, which providesa measure of the intensity gain between the two channels, was approximately equal to 1 for all arrays, indicating that the channels were approximatelybalanced. For each array, the ratio intensity values were normalized to account To investigate whether different chemical for the imbalance between the 2 fluorescent dyes by multiplying the ratio agents produce distinguishable gene expression profiles in bi- intensity value by m. A probability distribution was fit to the data and used to ological systems, compounds belonging to 2 classes of rodent calculate a 95% confidence interval for the ratio intensity values. Genes havingnormalized ratio intensity values outside of this interval were considered liver toxicants were chosen for study (IARC 1977, 1987).
significantly differentially expressed.
Sprague-Dawley rats were exposed to 1 of 3 peroxisome pro- For each of the 3 replicate arrays for each sample, lists of differentially liferators (clofibrate, Wyeth 14,643, or gemfibrozil), or to an expressed genes at the 95% confidence level were created and deposited into enzyme inducer (phenobarbital), as described in Materials and the NIEHS MAPS database (Bushel et al., 2001). For each time point and each Methods. Animals were dosed orally via gavage with 250 animal, a query of the database yielded a list of genes that were differentially mg/kg/day of clofibrate, 250 mg/kg/day of Wyeth 14,643, 100 expressed in at least 2 of the 3 replicate hybridizations. A calculation using thebinomial probability distribution indicated that the probability of a single gene mg/kg/day of gemfibrozil, or 120 mg/kg/day of phenobarbital appearing on this list when there was no real differential expression is approx- in a volume of 10 ml/kg. The administered doses targeted the imately 0.0006. Hierarchical cluster analysis was carried out with the Cluster/ maximum tolerated dose (MTD) for each of the chemicals TreeView package (Eisen et al., 1998). The entire data set is available at (Butterworth et al., 1995). Histopathological examinations of liver sections were conducted as described in the methods Real-time quantitative PCR.
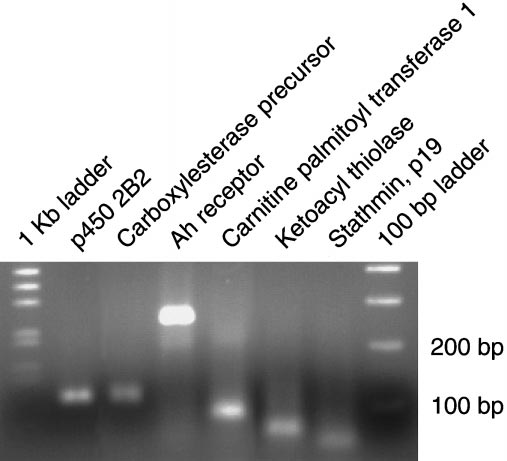
RNA samples representing single animals section to score the gross tissue and organ effect of the admin- treated with a peroxisome proliferator or phenobarbital for 24 h or 2 weeks istered doses at each time. No drug-related microscopic obser- (1852 [clofibrate, 24 hr], 1868 [Wyeth 14,643, 24 hr], 1878 [gemfibrozil, 24hr], 1890 [phenobarbital, 24 h], 888 [clofibrate, 2 weeks], 898 [Wyeth 14,643, vations were apparent in animals sacrificed 24 h after a single 2 weeks], 912 [gemfibrozil, 2 weeks], and 926 [phenobarbital, 2 weeks]) were treatment with any of the compounds, whereas drug-related used to validate the expression profile of 10 genes obtained using cDNA microscopic hepatocellular hypertrophy was observed in livers microarray data [AA818412 p450 2B2; AA996791 carnitine palmitoyl trans- of all the 2-week treated animals. For the 3 peroxisome pro- ferase 1; AI111901 tripeptidylpeptidase II; AA923966 Aflatoxin aldehyde liferators, hypertrophic hepatocytes were characterized by reductase; AA957359 p55cdc; AA957519 stathmin cytosolic phosphoproteinp19; AA965078 enoyl CoA isomerase; AA818188 ketoacyl thiolase; large cells with abundant microvesiculated eosinophilic cyto- AA963928 Ah receptor; AI070587 carboxylesterase precursor].
plasm. Large cells with abundant pale-staining eosinophilic The primers for the aforementioned genes were designed using Primer cytoplasm with basophilic stippling characterized hypertrophic Express威 software (Applied Biosystems, Foster City, CA) and custom made hepatocytes, in animals treated with phenobarbital.
(Research Genetics, Huntsville, AL). Primers that resulted in a single productwhich could be visualized on a 2% agarose gel were as follows: p450 2B2 Gene expression. In order to determine gene expression [forward primer AGTGCATCACAGCCAACATCA, reverse primer GAGG- changes associated with chemical exposure, liver mRNA was GAAAAGGTCCGGTAGAA]; carboxylesterase precursor [forward primer collected 24 h following a single exposure or after 2 weeks of AGTACTGGGCCAATTTTGCAA, reverse primer TGGGTGTCCAACTG- daily exposures to the compound. Competitive hybridizations CAGGTA]; Ah receptor [forward primer CATCCTGGAAATTCGAACCAA, of fluorescently labeled cDNA (Duggan et al., 1999) derived reverse primer TGCAAGAAGCCGGAAAACT]; carnitine palmitoyl trans-ferase 1 [forward primer CGGTTCAAGAATGGCATCATC, reverse primer from control vs. treated livers were used to measure relative abundance of each mRNA on the custom NIEHS cDNA mi- croarray Rat Chip v1.0, which contained ⬃1700 sequence- ACTCGTGAAC]; stathmin p19 [forward primer CACAATCCACTG- verified rat genes. We conducted statistical analyses of the GCAAGGAA, reverse primer TGCCATGTTGGACAGAAGACA].
microarray data and determined significantly changed genes Real-time PCR targeting the message corresponding to these 10 genes was performed using the ABI prism 7700 Sequence Detection System (Applied using a ratio distribution model at the 95% confidence level, as Biosystems, Foster City, CA) according to the manufacturer's instructions. The mentioned in the Materials and Methods section. We were able SYBR威 Green I labeling kit (Applied Biosystems, Foster City, CA), was used to reduce the probability of false positives in our data set by to detect double-stranded DNA generated during PCR amplification, used performing triplicate hybridizations on each of at least 3 inde- according to the manufacturer's instructions. Reverse transcription and PCR pendent biological samples and by including only genes ex- reactions were performed at the same time in a 50 l reaction containing 4 mMMgCl hibiting a binomial distribution probability ⱕ 0.0006 (Bushel 2, 0.8 mM of each dNTP, 100 ng total RNA, 0.4 M reverse primer and 0.4 M forward primer, 0.4 units/l RNasin, 0.025 units/l AmpliTaq Gold et al., 2001). These genes were utilized for further higher-level DNA polymerase (Roche, Basel, Switzerland) and 0.25 units/l MulV Reverse comparative analyses (e.g., clustering).
Transcriptase (Roche, Basel, Switzerland). Amplification reactions were car- The results obtained from the ried out using the following temperature profile: 48°C, 30 min; 95°C, 10 min;95°C, 15 s; 60°C, 1 min) for 40 cycles. Fluorescence emission was detected for collective microarray analysis of the peroxisome proliferator- each PCR cycle and the threshold cycle (C treated rat livers revealed significant gene expression changes T) values were determined. The CT HAMADEH ET AL.
Peroxisome Proliferator Effects on a Sampling of Genes
Biochemical pathway Hydrolysis of triglycerides Hydrolysis of glyceride- rich particles Lipid-binding protein Protein component of HDL Fatty acid binding protein Mitochondrial shuttling of FA First step in fatty acid -oxidation -Oxidation enzyme Enoyl CoA isomerase -Oxidation enzyme Glucose transporter Transport of glucose Lactate dehydrogenase Pyruvate carboxylase Gluconeogenesis enzyme Glycogen storage disease protein Fatty acid synthesis Stearoyl CoA desaturase Fatty-acid synthesis Fatty-acid synthase Structural protein Cell cycle/proliferation Histidine decarboxylase Converts histidine to histamine Acute phase proteins Retinol binding protein Note. Examples of genes whose levels were altered in a statistically significant manner after peroxisome proliferator exposure; genes were grouped by biochemical categories. The complete data set can be accessed at the NIEHS microarray Web site at http://dir.niehs.nih.gov/microarray/datasets.
in approximately 25% of the genes on the rat chip and eluci- observed the upregulation of previously reported cytochrome dated interesting molecular changes and pathway relationships P450 genes, such as CYP 2B2, 2C6, 3A9, and other genes such associated with peroxisome proliferator exposure (Table 1).
as epoxide hydrolase, diaphorase, and several GSTs (Furukawa These pathways include stimulation of triglyceride hydrolysis, et al., 1985; Griffin et al., 1984; Tavoloni et al., 1983; Whysner fatty acid uptake and conversion to acyl CoA derivatives, and et al., 1996) as well as the induction of several novel genes, stimulation of the -oxidation pathway. Observation of alter- such as carboxylesterase precursor. In addition, our novel ation of these pathways corroborates past data (Amacher et al., observation of the downregulation of carnitine palmitoyl trans- 1997; Schoonjans et al., 1996) and serves as a validation of the ferase 1 (CPT 1) in phenobarbital-treated rats may explain the use of microarrays to rapidly interrogate effector pathways of significant reduction (30 – 60%) of 4 carnitine constituents (to- tal and free carnitine and short- and long-chain fatty acid The mechanism of action of phenobarbital, a compound that carnitine esters) observed in serum from 471 patients treated has been studied for over 40 years, is only partially understood.
for convulsions with phenobarbital (Hug et al., 1991). The Similar to the peroxisome proliferator data, our phenobarbital combination of decreased CPT 1 levels and downregulation of microarray data corroborates previously described metabolic, Acyl CoA synthetase, a gene involved in the catalysis of fatty pharmacologic, and toxicologic effects of phenobarbital and acid esterification, suggests an inhibition of fatty acid peroxi- offers new clues that might be further investigated to better dation. Major metabolic pathways such as gluconeogenesis, define its mechanism of action (Table 2). For example, we glycolysis, -oxidation, and fatty acid peroxidation were de- GENE EXPRESSION ANALYSIS AND TOXIC MECHANISMS Phenobarbital Effects on a Sampling of Genes
Biochemical pathway Hydrolysis of triglycerides Hydrolysis of glyceride rich particles Protein component of HDL Fatty acid transport/metabolism Acyl CoA synthetase Peroxidation of FFA Mitochondrial shuttling of FFA First step in fatty acid -oxidation Ketoacyl thiolase -oxidation enzyme Enoyl CoA isomerase -oxidation enzyme Trans-mitochondrial membrane shuttling Lactate dehydrogenase Conversion of pyruvate to lactate Pyruvate carboxylase Gluconeogenesis enzyme Alcohol dehydrogenase Conversion of acetaldehyde to ethanol Fatty acid synthesis Stearoyl CoA desaturase Fatty acid synthesis Fatty acid synthase Converts acetaldehyde to acetyl CoA Rho-associated protein kinase Rearrangement of actin Involved in cirrhosis Cell cycle/proliferation DNA synthesis/repair ADP-ribosyl transferase AIRC-SAICAR synthase Acute phase proteins Retinol-binding protein Microsomal and related enzymes Microsomal metabolizing enzyme Microsomal metabolizing enzyme Microsomal metabolizing enzyme Epoxide hydrolase Microsomal metabolizing enzyme Microsomal metabolizing enzyme Heme biosynthesis C kinase substrate Role in induction of P450 enzymes Role in induction of P450 enzymes Dopa decarboxylase Role in induction of P450 enzymes Detoxification enzymes Aflatoxin aldehyde reductase Detoxification of aflatoxin B1 Multitude of tumors Biomarkers of carcinogenesis Liver pre-neoplastic foci Salivary gland tumorigenesis Aromatic hydrocarbon receptor 17 Hydroxysteroid dehydrogenase Note. Examples of genes whose levels were altered in a statistically significant manner after phenobarbital exposure; genes were grouped by biochemical categories. The complete data set can be accessed at the NIEHS microarray Web site at http://dir.niehs.nih.gov/microarray/datasets.
HAMADEH ET AL.
creased by phenobarbital treatment, while fatty acid synthesiswas stimulated (Argaud et al., 1991; Thurman and Marazzo,1975). Although some of these gene inductions were previ-ously reported, there has been little effort to integrate theobservations in the context of phenobarbital's mechanism ofaction. Our results offer a more comprehensive overview ofmolecular responses to toxicant exposure by revealing thecoordinate expression of multiple genes in homeostasis andmetabolic pathways. The agreement of the expression profilesfor phenobarbital and peroxisome proliferators with past, tra-ditional studies lends confidence in the use of these geneexpression profiles in further pattern recognition applications.
Gene expression validation.
Our gene expression data is
validated in 3 ways. The first is by replicate analysis. We used3 animals for each compound and measured the gene expres-sion for each animal on 3 chips. This approach generated 9measurements for each gene. The combined use of a confi-dence interval and the binomial probability aided in eliminat-ing genes with high biological or technical variability fromfurther analyses (i.e., clustering). Secondly, we routinely con-
Assessment of amplification of the RT-PCR specificity validation
experiment using agarose gel electrophoresis: 60 l of PCR reaction product
duct resequencing of the clones we find significantly changed.
corresponding to each gene were concentrated, then separated on a 2% agarose
Currently, our clone set shows an accuracy of approximately
gel. Marker ladders (1 kb and 100 bp; Invitrogen, Carlsbad, CA) were run on
90%. Identification of clones is updated on our Web site,
either side of the samples. Each lane shows a representative product for the
http://dir.niehs.nih.gov/microarray/chips.htm. Finally, we vali-
gene indicated.
dated the expression profile of 10 genes across samples derivedfrom individual animals exposed to peroxisome proliferators or
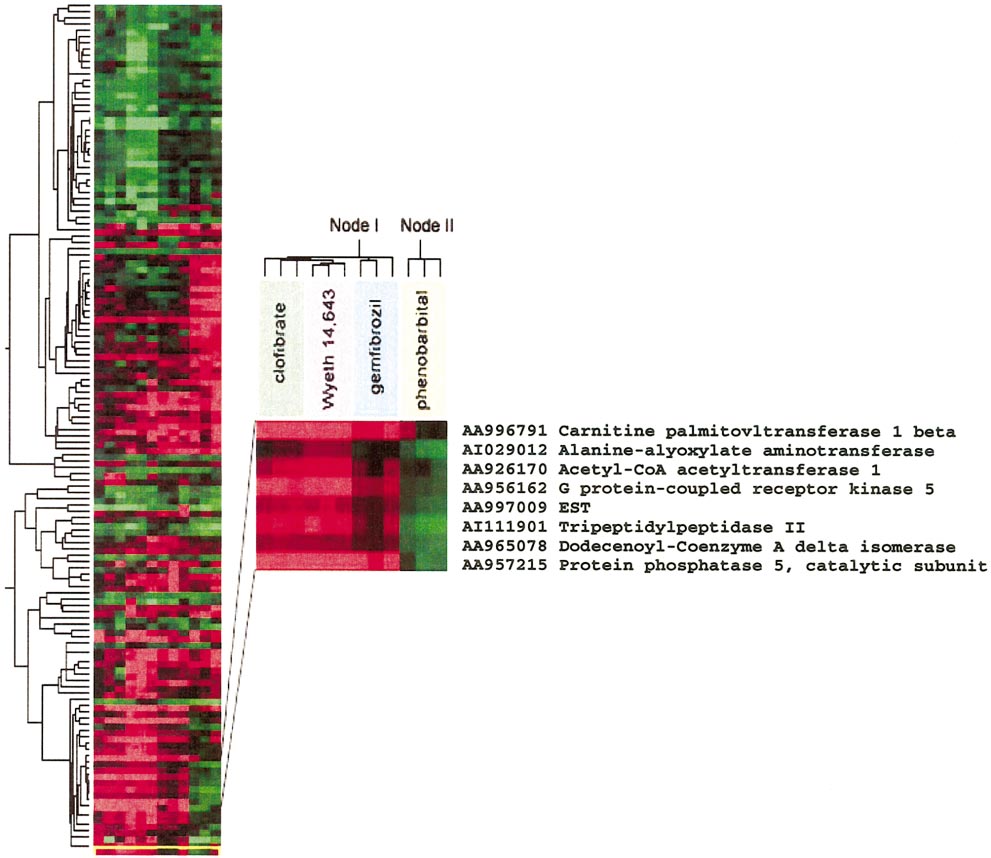
fibrozil, or clofibrate. Furthermore, in the latter node, individ-
phenobarbital at the 24-h and 2-week time points. Sample PCR
ual animals were clustered in separate subnodes denoting the
products were run on a 2% agarose gel and visualized by
specific peroxisome proliferator to which they were exposed.
ethidium bromide staining. A representative gel indicating the
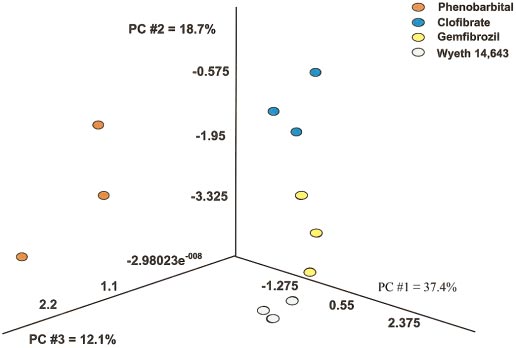
We used principal components analysis (PCA), which is a
quality of the reactions is shown in Figure 1. Comparison of
pattern recognition technique that represents a multivariate
data from cDNA microarray and real-time polymerase chain
statistical method that is useful for reducing multidimensional
reaction (RT-PCR) evaluations demonstrated a high level of
data (such as high-density gene expression data) down to 2 or
correlation between the 2 approaches (Table 3), where the
3 dimensions that can be readily comprehended. The principal
induction or repression of each gene was confirmed across
components were new variables created from linear combina-
multiple samples. Microarray measurements are typically only
tions of the starting variables (genes), where each principal
semiquantitative, with compression of values occurring at
component is orthogonal or not correlated with all others. The
high-fold changes. The RT-PCR measurements are likely to
first principal component contained the largest part of the
provide better quantitation for genes such as p4502B2 (pheno-
variance of the data set (37.5%) with the subsequent principal
barbital 12.42 fold on microarray, 32-fold by RT-PCR), but
components containing correspondingly smaller amounts of
generally the quantitative measurements with the 2 approaches
variance (18.7 and 12.1% for 2nd and 3rd, respectively). This
are well correlated (Table 3).
analysis allowed the visualization, in 3-dimensional space for
A critical question in toxicogenomics
simplicity, of the discrimination between the gene expression
is whether gene expression information may be used to reveal
responses elicited by these 2 classes of compounds (Fig. 3).
chemical-specific signature patterns. We used several compu-
PCA demonstrated close proximity in the gene expression
tational analyses to determine whether different toxicants result
pattern between clofibrate-, Wyeth 14,643-, and gemfibrozil-
in distinguishable gene expression patterns. Application of
exposed animals, but indicated a distinct partition (separation)
hierarchical cluster analysis (Eisen et al., 1998) confirmed that
between these compounds and phenobarbital-exposed animals.
individual animals could be distinguished by the class of tox-
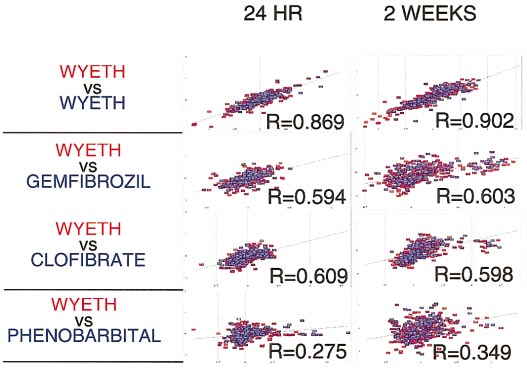
Finally, pairwise comparisons (Fig. 4) of gene expression
icants to which they were exposed (Fig. 2) and revealed 2
profiles of individual animals exposed to chemicals showed
distinct nodes containing animals treated with either of the 2
confirmation of the discerning potential of microarray data.
classes of chemicals. Across experiments, one node represents
Comparison of gene expression profiles of two different ani-
the 3 animals that were exposed to phenobarbital, while the
mals exposed to the same compound resulted in a relatively
other node includes animals treated with Wyeth 14,643, gem-
high correlation (e.g., r ⬎ ⫹0.8 for Wyeth 14,643 vs. Wyeth
GENE EXPRESSION ANALYSIS AND TOXIC MECHANISMS
Validation of cDNA Microarray Data by Real-Time PCR
Accession no.
RT-PCR cDNA RT-PCR cDNA RT-PCR cDNA RT-PCR cDNA RT-PCR cDNA RT-PCR cDNA RT-PCR cDNA RT-PCR cDNA
Carnitine Palmitoyl Transferase 1
Aflatoxin aldehyde reductase
Cytosolic phosphoprotein (p19)
Enoyl CoA isomerase
Ah receptor
Note. Values are fold induction/repression over control. C, clofibrate; W, Wyeth 14,643; G, gemfibrozil; P, phenobarbital; RT-PCR, real-time polymerase chain
reaction-derived data (average of 3 measurements); cDNA, cDNA microarray-derived data (average of 3 measurements).
14,643) as compared to animals exposed to different com-
exposure to the chemicals used in this study. Figure 6 illus-
pounds belonging to the same class (e.g., r ⬃ ⫹0.6 for Wyeth
trates the value of studying multiple time points, and the cluster
14,643 vs. gemfibrozil or clofibrate). However, comparisons of
indicates genes that are altered at the delayed time point. These
animals treated with toxicants belonging to different classes of
genes may be further investigated or corroborated in future
compounds resulted in a relatively low correlation (e.g., r ⬍ ⫹
studies for their association with chronic toxicity or adaptation
0.4 for Wyeth 14,643 vs. phenobarbital). In summary, the data
in Figures 2, 3, and 4 indicate that through multiple approachesand bioinformatics tools, it is possible to discriminate gene
expression profiles generated as a response to distinct livertoxicants. Proof of this concept aids in validation of the future
The goal of this study was to determine whether generation
potential of a predictive toxicogenomic strategy.
of chemically associated gene expression profiles, using mi-
Time dependency of gene expression.
One potential appli-
croarray technology, would permit classification of compound
cation of microarrays in toxicology is their use in predicting
associated signatures. We generated gene expression profiles
toxicity of undefined chemicals prior to the appearance of
corresponding to 3 peroxisome proliferators, clofibrate, Wyeth
pathological or disease outcomes. Gene expression profiles
14,643, and gemfibrozil, and an enzyme inducer, phenobarbi-
from animals treated with a compound of unknown toxicity
tal, and demonstrated that gene expression profiling is indeed a
may be compared with a database of DNA microarray-gener-
powerful tool for distinguishing gene expression generated by
ated gene expression data corresponding to known compounds.
structurally unrelated toxicants in an in vivo model. Those
However, toxicological effects are confounded by time and
distinctions were made even when compounds shared some
dose dependency of lesions that lead to differences in gene
endpoints such as peroxisome proliferation. A greater similar-
expression signatures. Therefore, we evaluated whether time-
ity was found among peroxisome proliferators than among the
independent gene expression responses that represent signa-
peroxisome proliferators and phenobarbital. Clustering of
tures of chemical-specific alterations occur. Application of
genes that were significantly affected by the 24-h exposures,
clustering methods to the data from phenobarbital and the
where no histopathological abnormalities were detected, dem-
peroxisome proliferators at 2 time points allowed the identifi-
onstrated that gene expression profiles might be successfully
cation of time-independent regulation (up or down) of genes in
used for compound classification.
response to compound treatment (Fig. 5). Those genes that are
Whether animals should be grouped together as a pool or
regulated in the same fashion upon compound exposure at
examined individually represents one issue in the design of
multiple time points may potentially serve as reliable biomar-
toxicogenomics studies. Some investigators advocate pooling
kers of effect when establishing time-independent gene expres-
for the costly microarray analysis and using individual animals
sion profiles.
for the follow-up verification steps. However, pooling may
RNA based gene expression analysis may be regarded as a
cause misinterpretation of data if one animal shows a remark-
snapshot of molecular occurrences in time/space. Analysis of
ably distinct response, or lack of response. In this study we
expression at one time point can be misleading due to transient
analyzed individual chemically exposed animals against a pool
and delayed gene expression events. We studied transient and
of control animals. The generation of gene expression profiles
delayed alterations in gene expression in response to the daily
corresponding to 3 animals exposed to the same compound, as
HAMADEH ET AL.
Different class compound toxicants generate discrete gene expression profiles. Genes whose expression profile was significantly altered in any
toxicant-exposed animal at the 24-h time point were clustered according to their expression levels across animals. Samples were also clustered based on thepattern of expression of the studied genes. A node is highlighted showing the expression pattern of a subset of genes representative of the overall grouping ofsamples derived from the livers of chemically exposed rats.
opposed to pooling, allowed for the detection of interanimal
There is high concordance of the expression changes found
differences. This facilitated the testing of the robustness of
in the microarray analyses in phenobarbital-exposed rats with
DNA microarray technology and pattern recognition algo-
the results obtained by scientists using other methodologies
rithms to generate distinguishable gene expression profiles,
over many years of study. This concordance is illustrated in a
despite the existence of differences in response across similarly
display for gene expression changes in the form of an "effector
treated animals. Although we have observed similarities as
pathway map" (EPM) for chemical action. The phenobarbital
high as about 90% between animals exposed to the same
gene expression profile data set was mapped into previously
agents, this similarity showed chemical dependence, reaching
defined cellular response pathways to demonstrate the infor-
about 80% with some of the compounds. The best interanimal
mational power of this type of data presentation (Fig. 7).
correlation was observed among Wyeth 14,643-treated ani-
Organization of data in this integrated diagram facilitates clear
mals, where we saw the greatest number of statistically signif-
visualization of regulatory and molecular events occurring as a
icant gene expression modulations, suggesting that compound
response to chemical exposure and visualization of pathways
potency may be positively related to decreased variation in
that were affected by phenobarbital. At a glance, this diagram
gene expression response.
illustrates how the gene expression profile data has corrobo-
GENE EXPRESSION ANALYSIS AND TOXIC MECHANISMS
gene function. The majority of genes that were expressed in atime-independent fashion in response to phenobarbital or peroxi-some proliferator treatment corresponded to enzymes that func-tion in compound metabolism (Fig. 5A; p450 2B2, epoxide hy-drolase 1, GST, aflatoxin B1 aldehyde reductase) or cellbiochemical processes (Figs. 5A–5C; Acyl CoA oxidase, Carni-tine palmitoyltransferase 1, histidine decarboxylase, stearyl-CoAdesaturase). This makes sense when one considers that animalswere treated with the studied chemicals on a daily basis, furnish-ing recurring surges in blood levels of the compounds in theexposed animals, and thus affecting compound metabolism genesor downstream effects.
Metabolism-related genes were notably absent from the tran-
siently altered transcripts, the majority of which representedsignaling related genes (Fig. 6A). This is consistent with the
The Partek Pro 2000 software package was used for visual PCA
transient nature of the response and these genes probably
of the data for genes that were altered in a statistically significant manner with
constituted an initial response in the liver upon exposure to the
any of the treatments used. The first principal component for this data setaccounted for 37.4% of the variation present, the second component for an
specific toxicants for the first time. Alterations in gene expres-
additional 18.7%, and the third for 12.1%. Each colored point represents data
sion that were present at 2 weeks of exposure but not at the
from an individual animal treated with the respective agent for 24 h.
24-h time point (Fig. 6B) constituted delayed responses totoxicant exposure. These responses could be associated withadaptation events or with the relation to the histopathological
rated past findings (Fig. 7, yellow targets) and may contribute
observation of hypertrophy noted in all animals treated by
new mechanistic insights (Fig. 7, blue targets).
chemicals for 2 weeks. These changes could also be due to
Chronic cell proliferation is proposed as a major mechanism
overt toxicity that may be manifested in gene expression re-
for tumor promotion by phenobarbital (Barbason et al., 1983;
sponses but not necessarily detected by histopathological ex-
Feldman et al., 1981; Whysner et al., 1996). Histopathological
amination until a much longer period of exposure.
analysis indicated liver enlargement at 2 weeks in phenobar-bital-treated animals. Several studies have demonstrated thatphenobarbital induced increases in DNA synthesis in rats andmice of various strains (Busser and Lutz, 1987). Our datacorroborates phenobarbital-induced increase in cell prolifera-tion. Transcript levels for DNA polymerase b, AIRC-SAICARsynthase, cyclin B1, and ARF-like factor (ARL5) were in-creased at the 24-h and 2-week time points, relative to controls,by phenobarbital exposure, indicating increased DNA synthe-sis and liver proliferation. This observation is further supportedby the modulation in cytoskeleton rearrangement-relatedgenes, such as rho-associated protein kinase, which is essentialfor the rearrangement of actin cytoskeleton (Ohashi et al.,2000; Watanabe et al., 1999), suggesting a role for thesealterations in the hypertrophy observed in the livers of theexposed animals. We also observed the upregulation of phos-phoprotein stathmin (p19) at the 2 time points in response tophenobarbital exposure. Phosphoprotein stathmin (p19), whichis abundant in neuroendocrine tumor cells, showed a 15-fold
The ratios of exposed to control animals corresponding to tran-
script levels of genes whose expression was significantly altered in any
greater abundance in newborn than in adult brain and its levels
toxicant-exposed animal at the 24-h time point, were compared via set pairwise
increased after two-thirds partial rat hepatectomy (Koppel et
correlation analysis using Spotfire software (Spotfire, Inc., Cambridge, MA).
al., 1993), suggesting a role in regeneration and growth of
Comparison of rats treated with the sample compound showed the highest
various tissues. These data support the observation that phe-
correlation (Wyeth 14,643-treated animals). Comparison of Wyeth 14,643 with
nobarbital produces liver enlargement due to proliferation of
either clofibrate- or gemfibrozil-treated animals yielded appreciable correla-tion, which was in agreement with the fact that both of those compounds
liver cells and offers new insights on its molecular basis.
belonged to the same peroxisome proliferator class of toxicants. The correla-
Analysis of transient, delayed, and time-independent alterations
tion dropped sharply when Wyeth 14,643- and phenobarbital-treated animals
suggested a relationship between the pattern of expression and
were compared, and indicated poor correlation.
HAMADEH ET AL.
Two-dimensional, hierarchical clustering analysis of genes that were altered in a statistically significant manner at 95% confidence level in at least 2 of the
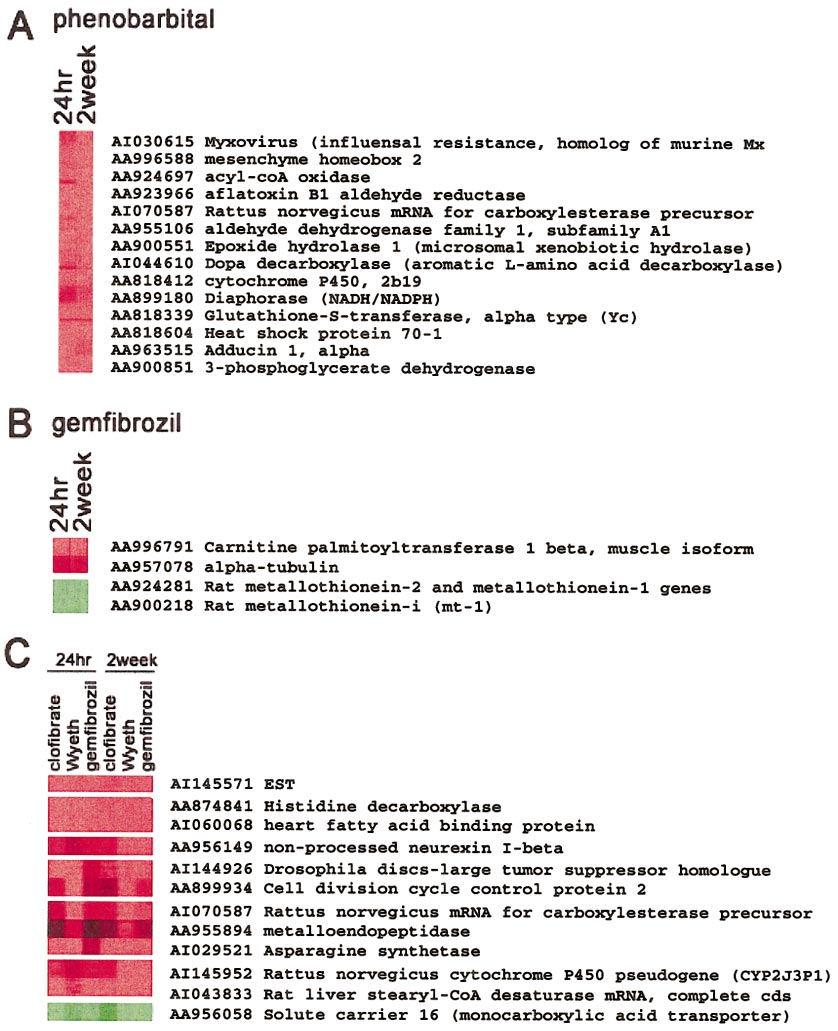
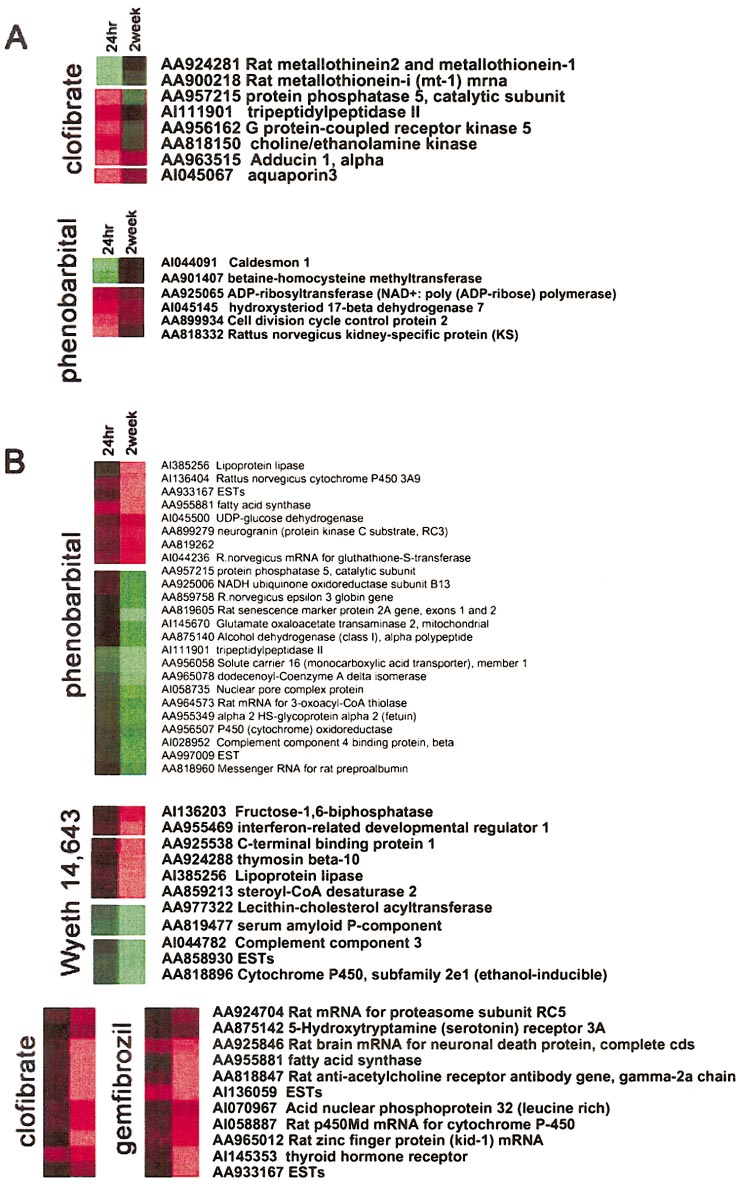
replicate hybridizations performed on each sample. Data from 9 hybridizations, representing 3 replicates of 3 independent biological samples derived from rats treatedwith the same compound at each time point, were averaged, and those values were used for clustering analysis. Clustering analysis was performed across genes but notanimals. Genes are represented on the vertical axis while animals are on the horizontal axis. (A) Highlighted nodes from a hierarchical clustering tree, showing a suiteof genes whose transcripts were increased in phenobarbital-exposed animals over controls in a time-independent fashion. (B) Genes modulated by gemfibrozil treatmentin a similar fashion at 24 h and 2 weeks of exposure. (C) Nodes showing different genes that were modulated by peroxisome proliferators collectively in atime-independent fashion. Red, gene induction; green, gene repression in the treated samples, relative to control.
We have successfully generated gene expression profiles
cals from the same class of compounds give rise to discern-
for 3 peroxisome proliferators and an enzyme inducer, and
able gene expression profiles that bear more similarity to
we were able to show, through the application of pattern
each other than to patterns corresponding to exposure to
recognition algorithms and computational analyses, that
compounds from a different class. Systematic development
these patterns were distinct. We demonstrated that chemi-
of an expanded database for gene expression responses to
GENE EXPRESSION ANALYSIS AND TOXIC MECHANISMS
Illustration of transient ver-
sus delayed responses in gene expres-sion. Nodes from 4 hierarchical cluster-ing trees corresponding to the chemicalsused in this study were highlighted toshow examples of (A) transiently alteredtranscripts or (B) genes that required adelayed period of time for up- or down-regulation, implicating those genes aspossible biomarkers of toxicant-associ-ated delayed toxicity or adaptation to ex-posure. Red, gene induction; green, generepression in the treated samples, relativeto control.
drugs and environmental pollutants may yield compound-
cals that we utilized. In addition, our data revealed gene
specific signature patterns that would also provide insights
expression that has not been previously associated with the
into affected regulatory and proliferative and repair/adap-
compounds we used and suggest that such results will
tive pathways. We demonstrated the validity of our expres-
provide valuable targets for further investigations of the
sion data by corroborating published reports on the chemi-
mechanism of action of chemical hazards.
HAMADEH ET AL.
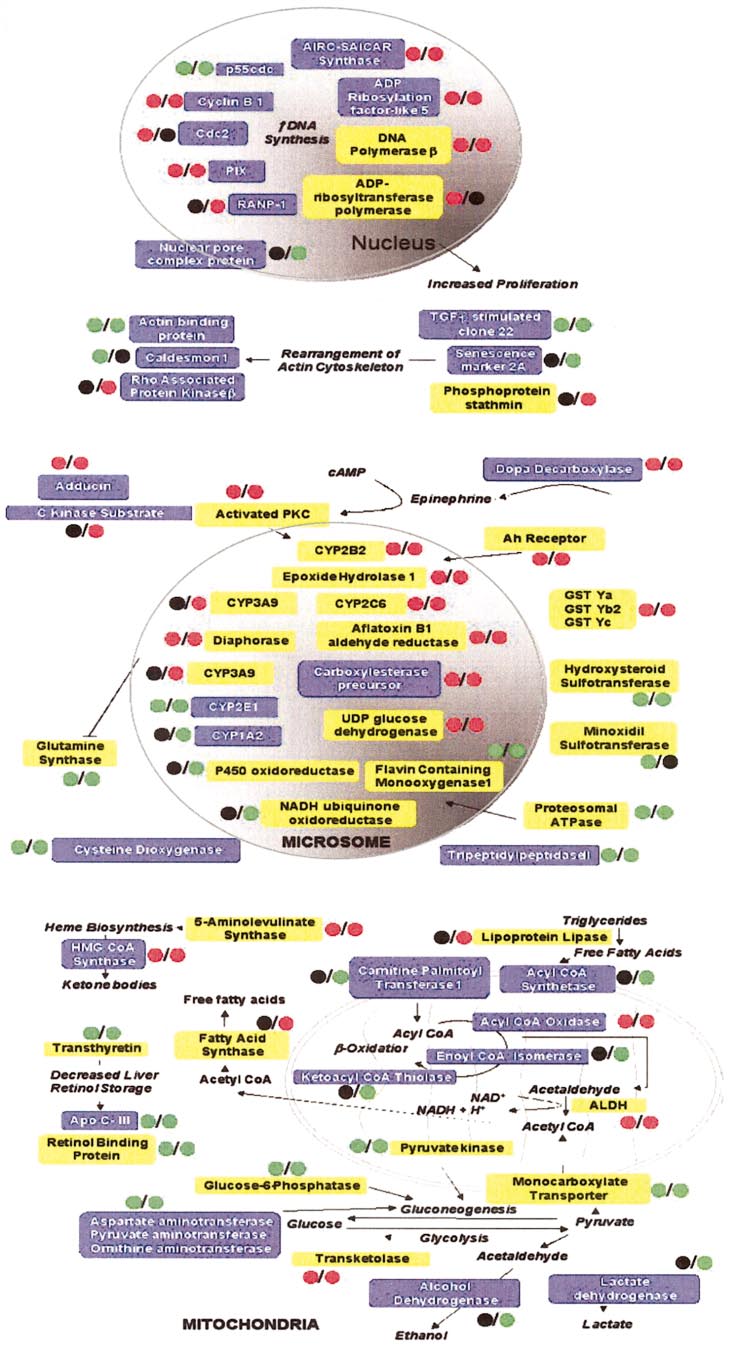
Genes modulated with phe-
nobarbital exposure, displayed as a mapof effector pathways of toxicant (MEPT),a schematic diagram of phenobarbital-modulated gene expression events. En-zymes enclosed in yellow boxes werealtered in this study and were previouslyreported in the literature to be modulatedby phenobarbital treatment, while thosein blue were not previously associatedwith phenobarbital exposure and arenovel observations. The colored circlesindicate the type of modulation. The cir-cle before the slash in each groupingdenotes the 24-h time point; the circleafter the slash, the 2-week time point.
Red, upregulation; green, downregula-tion; black, no change.
GENE EXPRESSION ANALYSIS AND TOXIC MECHANISMS
tor, on the activities of rat liver glutathione-requiring enzymes and catalase
in comparison to the action of phenobarbital. Cancer Res. 45, 5011–5019.
We thank Julie Foley, Jeffrey Tucker, Kelli Reynolds, Jeffrey Reece, Jen-
Griffin, M. J., Kirsten, E., Carubelli, R., Palakodety, R. B., McLick, J., and
nifer Collins, and Dr. Johnathan Ladapo for assistance in analyzing and
Kun, E. (1984). The in vivo effect of benzamide and phenobarbital on liver
compiling the data from this study. In addition, we acknowledge and thank
enzymes: Poly(ADP-ribose) polymerase, cytochrome P-450, styrene oxide
Drs. Jeff Trent, Mike Bittner, and Pat Hurban, and Donald Cox, for advice in
hydrolase, cholesterol oxide hydrolase, glutathione S-transferase and UDP-
development of our microarray center. We also thank Nigel Walker and Chris
glucuronyl transferase. Biochem. Biophys. Res. Commun. 122, 770 –775.
Miller for their help and guidance in the RT-PCR analysis. Finally, we thank
Hamadeh, H. K., Bushel, P. B., Paules, R., and Afshari, C. A. (2001).
Drs. Thomas Kunkel, Robert Maronpot, Samuel Wilson, Paul Nettesheim, and
Discovery in toxicology: Mediation by gene expression array technology.
Masahiko Negishi for helpful comments on the preparation of this manuscript.
J. Biochem. Mol. Toxicol. 15, 231–242.
Hug, G., McGraw, C. A., Bates, S. R., and Landrigan, E. A. (1991). Reduction
of serum carnitine concentrations during anticonvulsant therapy with phe-nobarbital, valproic acid, phenytoin, and carbamazepine in children. J. Pe-
Amacher, D. E., Beck, R., Schomaker, S. J., and Kenny, C. V. (1997). Hepatic
diatr. 119, 799 – 802.
microsomal enzyme induction, -oxidation, and cell proliferation following
IARC (1977). IARC monographs on the evaluation of the carcinogenic risk of
administration of clofibrate, gemfibrozil, or bezafibrate in the CD rat. Toxi-
chemicals to man: Some miscellaneous pharmaceutical substances. IARC
col. Appl. Pharmacol. 142, 143–150.
Monogr. Eval. Carcinog. Risk Chem. Man. 13, 1–255.
Argaud, D., Halimi, S., Catelloni, F., and Leverve, X. M. (1991). Inhibition of
IARC (1987). Overall evaluations of carcinogenicity: An updating of IARC
gluconeogenesis in isolated rat hepatocytes after chronic treatment with
Monographs volumes 1 to 42. IARC Monogr. Eval. Carcinog. Risks Hum. 7
phenobarbital. Biochem. J. 280, 663– 669.
(Suppl.), 1– 440.
Barbason, H., Rassenfosse, C., and Betz, E. H. (1983). Promotion mechanism
Koppel, J., Loyer, P., Maucuer, A., Rehak, P., Manceau, V., Guguen-Guil-
of phenobarbital and partial hepatectomy in DENA hepatocarcinogenesis
louzo, C., and Sobel, A. (1993). Induction of stathmin expression during
cell-kinetics effect. Br. J. Cancer 47, 517–525.
liver regeneration. FEBS Lett. 331, 65–70.
Biegel, L. B., Hurtt, M. E., Frame, S. R., Applegate, M., O⬘Connor, J. C., and
Melnick, R. L., Morrissey, R. E., and Tomaszewski, K. E. (1987). Studies by
Cook, J. C. (1992). Comparison of the effects of Wyeth 14,643 in Crl:CD
the National Toxicology Program on di(2-ethylhexyl)phthalate. Toxicol.
BR and Fisher-344 rats. Fundam. Appl. Toxicol. 19, 590 –597.
Ind. Health 3, 99 –118.
Burchiel, S. K., Knall, C. M. Davis, J. W., III, Paules, R. S. Boggs, S. E.
Nuwaysir, E. F., Bittner, M., Trent, J., Barrett, J. C., and Afshari, C. A. (1999).
Afshari, C. A. (2001). Analysis of genetic and epigenetic mechanisms of
Microarrays and toxicology: The advent of toxicogenomics. Mol. Carcinog.
toxicity: Potential roles of toxicogenomics and proteomics in toxicology.
Toxicol. Sci. 59, 193–195.
Ohashi, K., Nagata, K., Maekawa, M., Ishizaki, T., Narumiya, S., and Mizuno,
Bushel, P. R., Hamadeh, H., Bennett, L., Sieber, S., Martin, K., Nuwaysir,
K. (2000). Rho-associated kinase ROCK activates LIM-kinase 1 by phos-
E. F., Johnson, K., Reynolds, K., Paules, R. S., and Afshari, C. A. (2001).
phorylation at threonine 508 within the activation loop. J. Biol. Chem. 275,
MAPS: A microarray project system for gene expression experiment infor-
mation and data validation. Bioinformatics 17, 564 –565.
Schoonjans, K., Staels, B., and Auwerx, J. (1996). Role of the peroxisome
Busser, M. T., and Lutz, W. K. (1987). Stimulation of DNA synthesis in rat
proliferator-activated receptor (PPAR) in mediating the effects of fibrates
and mouse liver by various tumor promoters. Carcinogenesis 8, 1433–1437.
and fatty acids on gene expression. J. Lipid Res. 37, 907–925.
Tavoloni, N., Jones, M. J., and Berk, P. D. (1983). Dose-related effects of
Butterworth, B. E., Conolly, R. B., and Morgan, K. T. (1995). A strategy for
phenobarbital on hepatic microsomal enzymes. Proc. Soc. Exp. Biol. Med.
establishing mode of action of chemical carcinogens as a guide for ap-
174, 20 –27.
proaches to risk assessments. Cancer Lett. 93, 129 –146.
Thomas, R. S., Rank, D. R., Penn, S. G., Zastrow, G. M., Hayes, K. R., Pande,
Chen, Y., Dougherty, E, R., and Bittner, M. L. (1997). Ratio-based decisions
K., Glover, E., Silander, T., Craven, M. W., Reddy, J. K., Jovanovich, S. B.,
and the quantitative analysis of cDNA microarray images. J. Biomed. Optics
and Bradfield, C. A. (2001). Identification of toxicologically predictive gene
2, 364 –374.
sets using cDNA microarrays. Mol. Pharmacol. 60, 1189 –1194.
DeRisi, J., Penland, L., Brown, P. O., Bittner, M. L., Meltzer, P. S., Ray, M.,
Thurman, R. G., and Marazzo, D. P. (1975). Mixed-function oxidation and
Chen, Y., Su, Y. A., and Trent, J. M. (1996). Use of a cDNA microarray to
intermediary metabolism: Metabolic interdependencies in the liver. Adv.
analyse gene expression patterns in human cancer. Nat. Genet. 14, 457– 460.
Exp. Med. Biol. 58, 355–367.
Duggan, D. J., Bittner, M., Chen, Y., Meltzer, P., and Trent, J. M. (1999).
Waring, J. F., Ciurlionis, R., Jolly, R.A., Heindel, M., and Ulrich, R. G.
Expression profiling using cDNA microarrays. Nat. Genet. 21(Suppl. 1),
(2001a). Microarray analysis of hepatotoxins in vitro reveals a correlation
between gene expression profiles and mechanisms of toxicity. Toxicol. Lett.
Eisen, M. B., Spellman, P. T., Brown, P. O., and Botstein, D. (1998). Cluster
120, 359 –368.
analysis and display of genome-wide expression patterns. Proc. Natl. Acad.
Waring, J. F., Jolly, R. A., Ciurlionis, R., Lum, P. Y., Praestgaard, J. T.,
Sci. U.S.A 95, 14863–14868.
Morfitt, D. C., Buratto, B., Roberts, C., Schadt, E., and Ulrich, R. G.
Feldman, D., Swarm, R. L., and Becker, J. (1981). Ultrastructural study of rat
(2001b). Clustering of hepatotoxins based on mechanism of toxicity using
liver and liver neoplasms after long-term treatment with phenobarbital.
gene expression profiles. Toxicol. Appl. Pharmacol. 175, 28 – 42.
Cancer Res. 41, 2151–2162.
Watanabe, N., Kato, T., Fujita, A., Ishizaki, T., and Narumiya, S. (1999).
Fielden, M. R., and Zacharewski, T. R. (2001). Challenges and limitations of
Cooperation between mDia1 and ROCK in Rho-induced actin reorganiza-
gene expression profiling in mechanistic and predictive toxicology. Toxicol.
tion. Nat. Cell Biol. 1, 136 –143.
Sci. 60, 6 –10.
Whysner, J., Ross, P. M., and Williams, G. M. (1996). Phenobarbital mecha-
Furukawa, K., Numoto, S., Furuya, K., Furukawa, N. T., and Williams, G. M.
nistic data and risk assessment: Enzyme induction, enhanced cell prolifer-
(1985). Effects of the hepatocarcinogen nafenopin, a peroxisome prolifera-
ation, and tumor promotion. Pharmacol. Ther. 71, 153–191.
Source: http://blumberg-serv.bio.uci.edu/past%20teaching/bio145b-sp2004/required%20reading/hamadeh-2002.pdf
09.informationbulletin.october.pub
THE INFORMER INFORMATION BULLETIN OF THE ISLAND GOVERNMENT OF ST. EUSTATIUS Volume 1, Issue 2 OCTOBER ISSUE , 2009 Dutch civil servants supporting transition St. Eustatius– The Dutch civil servants of the Ministry of Traffic and Water Management visited their local counter-parts on Tuesday September 8th 2009, to discuss Air Traffic Control, Air Space and Airport Development after the tran-sition. One of the topics was the condi-tion of the servicing of the landing strip. This point needs priority in the master plan. Another issue which has the at-tention is the airlift to and from the is-land. A market scan for airlift is in the making. During their visit they met with, Planning Officer, Mr Maldwyn Timber, of Planning, Mr. Ellis Schmidt, Airport Manager, and the Executive Council. The Airdrome will remain a responsibility of the Island Government. They discussed navigation aids, airspace and airport developments . The agree-
wcauk.org
Achieving effective outcomes in patients with overgranulation Jackie Stephen-Haynes RGN DN DipH BSc (Hons) ANP. PG DipR PGDip Ed, Masters in Clinical Nursing Consultant Nurse and Senior Lecturer in Tissue Viability for Worcestershire Primary Care Trusts and University of Worcester. Stourport Health centre, Worcester St, Stouport on Severn, Worcestershire.DY13 8EH