Massive bioaccumulation and self‐assembly of phenazine compounds in live cells


Massive Bioaccumulation and Self-Assembly of Phenazine
Compounds in Live Cells
Kyoung Ah Min , Walajapet G. Rajeswaran , Rudolf Oldenbourg , Grant Harris , Rahul K. Keswani , Mason Chiang , Phillip Rzeczycki , Arjang Talattof , Mahwish Hafeez , Richard W. Horobin , Scott D. Larsen , Kathleen A. Stringer , and Gus R. Rosania *
antigens, defense against invading patho-
Clofazimine is an orally administered drug that massively bioaccumulates in
gens, and mounting of protective immune responses. [ 1 ] In addition, macrophages play
macrophages, forming membrane-bound intracellular structures possessing
a physiological role in the disposition of lipo-
nanoscale supramolecular features. Here, a library of phenazine compounds
philic, poorly soluble small molecule chem-
derived from clofazimine is synthesized and tested for ability to accumulate
ical agents. In the liver, for example, Kupffer
and form ordered molecular aggregates inside cells. Regardless of chemical
cells sequester lipids, cholesterol, fat soluble
structure or physicochemical properties, bioaccumulation is consistently
vitamins, xenobiotics, and drugs. [ 2 ] Perhaps
greater in macrophages than in epithelial cells. Microscopically, some self-
it is not too surprising that clofazimine, an old but highly effective antibiotic that
assembled structures exhibit a pronounced, diattenuation anisotropy signal,
is included in the World Health Organiza-
evident by the differential absorption of linearly polarized light, at the peak
tion's list of essential medications and part
absorbance wavelength of the phenazine core. The measured anisotropy is
of the standard treatment of leprosy, [ 3 ] has
well above the background anisotropy of endogenous cellular components,
been found to massively bioaccumulate in
refl ecting the self-assembly of condensed, insoluble complexes of ordered
macrophages. [ 4 ] In these cells, clofazimine forms crystal-like drug inclusions (CLDIs):
phenazine molecules. Chemical variations introduced at the R-imino position
highly organized, insoluble molecular com-
of the phenazine core lead to idiosyncratic effects on the compounds' bioac-
plexes that are predominantly found in
cumulation behavior as well as on the morphology and organization of the
membrane-bound compartments within
resulting intracellular structures. Beyond clofazimine, these results demon-
the cytoplasm. [ 4 ] Although drug crystal for-
strate how the self-assembly of membrane permeant, orally bioavailable small
mation has generally been regarded as an
molecule building blocks can endow cells with unnatural structural elements
unwanted side effect, clofazimine is a well-tolerated, clinically useful drug. Thus, in the
possessing chemical, physical, and functional characteristics unlike those of
case of clofazimine, CLDIs may function as
other natural cellular components.
a biocompatible, intracellular drug depot mechanism. More generally, CLDI forma-tion could be exploited as a means to target
drugs to macrophages in living organisms and to endow these
1. Introduction
cells with unnatural structural and functional elements for diag-
In mammals, macrophages orchestrate many key physiological nostic or therapeutic purposes. functions, including wound healing and regeneration, clear-
Related to clofazimine, Neutral Red is a phenazine com-
ance of apoptotic and necrotic cells, recognition of foreign pound that undergoes accumulation in lysosomes,
Dr. K. A. Min, Dr. R. K. Keswani, M. Chiang, P. Rzeczycki, A. Talattof,
Prof. R. W. Horobin
M. Hafeez, Prof. G. R. Rosania
School of Life Sciences
Department of Pharmaceutical Sciences
The University of Glasgow
University of Michigan College of Pharmacy
University Avenue , Glasgow G12 8QQ , Scotland , UK
428 Church St , Ann Arbor , MI 48109 , USA
Prof. K. A. Stringer
E-mail: [email protected]
Department of Clinical, Social and Administrative
Dr. W. G. Rajeswaran, Prof. S. D. Larsen
Department of Medicinal Chemistry
University of Michigan College of Pharmacy
University of Michigan College of Pharmacy
Ann Arbor , MI 48109 , USA
428 Church St , Ann Arbor , MI 48109 , USA
This is an open access article under the terms of the Creative Commons
Prof. R. Oldenbourg, G. Harris
Attribution License, which permits use, distribution and reproduction in
Marine Biological Laboratories
any medium, provided the original work is properly cited.
Woods Hole , MA 02543 , USA
Adv. Sci. 2015, 2, 1500025
2015 The Authors. Published by WILEY-VCH Verlag GmbH & Co. KGaA, Weinheim
(1 of 11) 1500025


Janus Green B is another phenazine compound that undergoes
determined that certain chemical modifi cations at the R-imino
electrical potential dependent accumulation in mitochondria. [ 6 ]
group promoted the self-assembly of phenazines, specifi cally
However, neither of these compounds exhibits the massive
in macrophages. The infl uence of these variations on bioaccu-
intracellular bioaccumulation or intracellular self-assembly mulation and structure formation seemed highly idiosyncratic. properties that are characteristic of clofazimine. Furthermore,
However, all compounds tended to preferentially accumulate
because of differences in membrane partitioning, the transport
in macrophages relative to epithelial cells, regardless of their
mechanisms mediating the cellular uptake and intracellular
chemical structure or physicochemical properties.
distribution of clofazimine may be different from that of less lipophilic, more soluble phenazine derivatives. [ 8 ] Therefore, to explore whether other phenazine compounds could provide a
2. Results and Discussion
good a starting point for developing new kinds of self-assem-bling intracellular elements for drug delivery and bioimaging
First, we synthesized a focused library of clofazimine deriva-
applications, we decided to examine the impact of variations in
tives ( Scheme 1 ), by replacing the chlorophenyl moieties of
lipophilicity and chemical structure on the intracellular uptake
clofazimine with different aromatic substituents ( Figure 1 a and
and traffi cking of phenazine compounds. For this purpose, we
Table S1 (Supporting Information), Compounds A–G). When
synthesized a small, focused library of phenazine derivatives
these compounds were incubated with cells, they exhibited
of clofazimine, and assayed their bioaccumulation and self-
similar or decreased intracellular staining relative to clofazi-
assembly properties in RAW264.7 macrophages and Madin-
mine, irrespective of their higher or lower lipophilicity relative
Darby Canine Kidney (MDCK) epithelial cells.
to clofazimine (Figure 1 a' and Table S2, Supporting Informa-
Because phenazines are chromophores with a broad absorb-
tion). Small changes in the chemical structure of clofazimine
ance peak in the range of visible wavelengths, the interaction
were associated with visibly different cellular staining pattern
of the phenazine ring with monochromic, polarized light could
in macrophages. In this fi rst series of phenazine compounds
be useful to specifi cally probe the intracellular accumulation,
(Compounds A–G), the chlorophenyl moiety of clofazimine
distribution, and molecular organization of the phenazine was replaced with various other closely related substituents, yet compounds. Accordingly, a quantitative polarization micro-
most of these substituents (Compounds A–F) led to decreased
scope (LC-PolScope) [ 9 ] was adapted to assay the formation of
cellular staining in relation to clofazimine. Only the replace-
condensed, ordered molecular aggregates of the compounds in
ment of chlorines with hydroxyls led to a staining pattern sim-
live cells. With this instrument, we measured the manner in
ilar to that of clofazimine (Compound G).
which the intracellular inclusions differentially infl uenced the
For comparison, we synthesized a second, focused series of
transmittance of polarized light—an optical property known
derivatives, in which the isopropyl group at the R-imino posi-
as diattenuation anisotropy. [ 10 ] By relating the extent of bioac-
tion of clofazimine was replaced with different achiral sub-
cumulation to the measured optical properties of the intracel-
stitutents (Figure 1 b and Table S3, Supporting Information,
lular inclusions formed by different phenazine derivatives, we
Compounds H–Q). Compared to clofazimine, replacing the
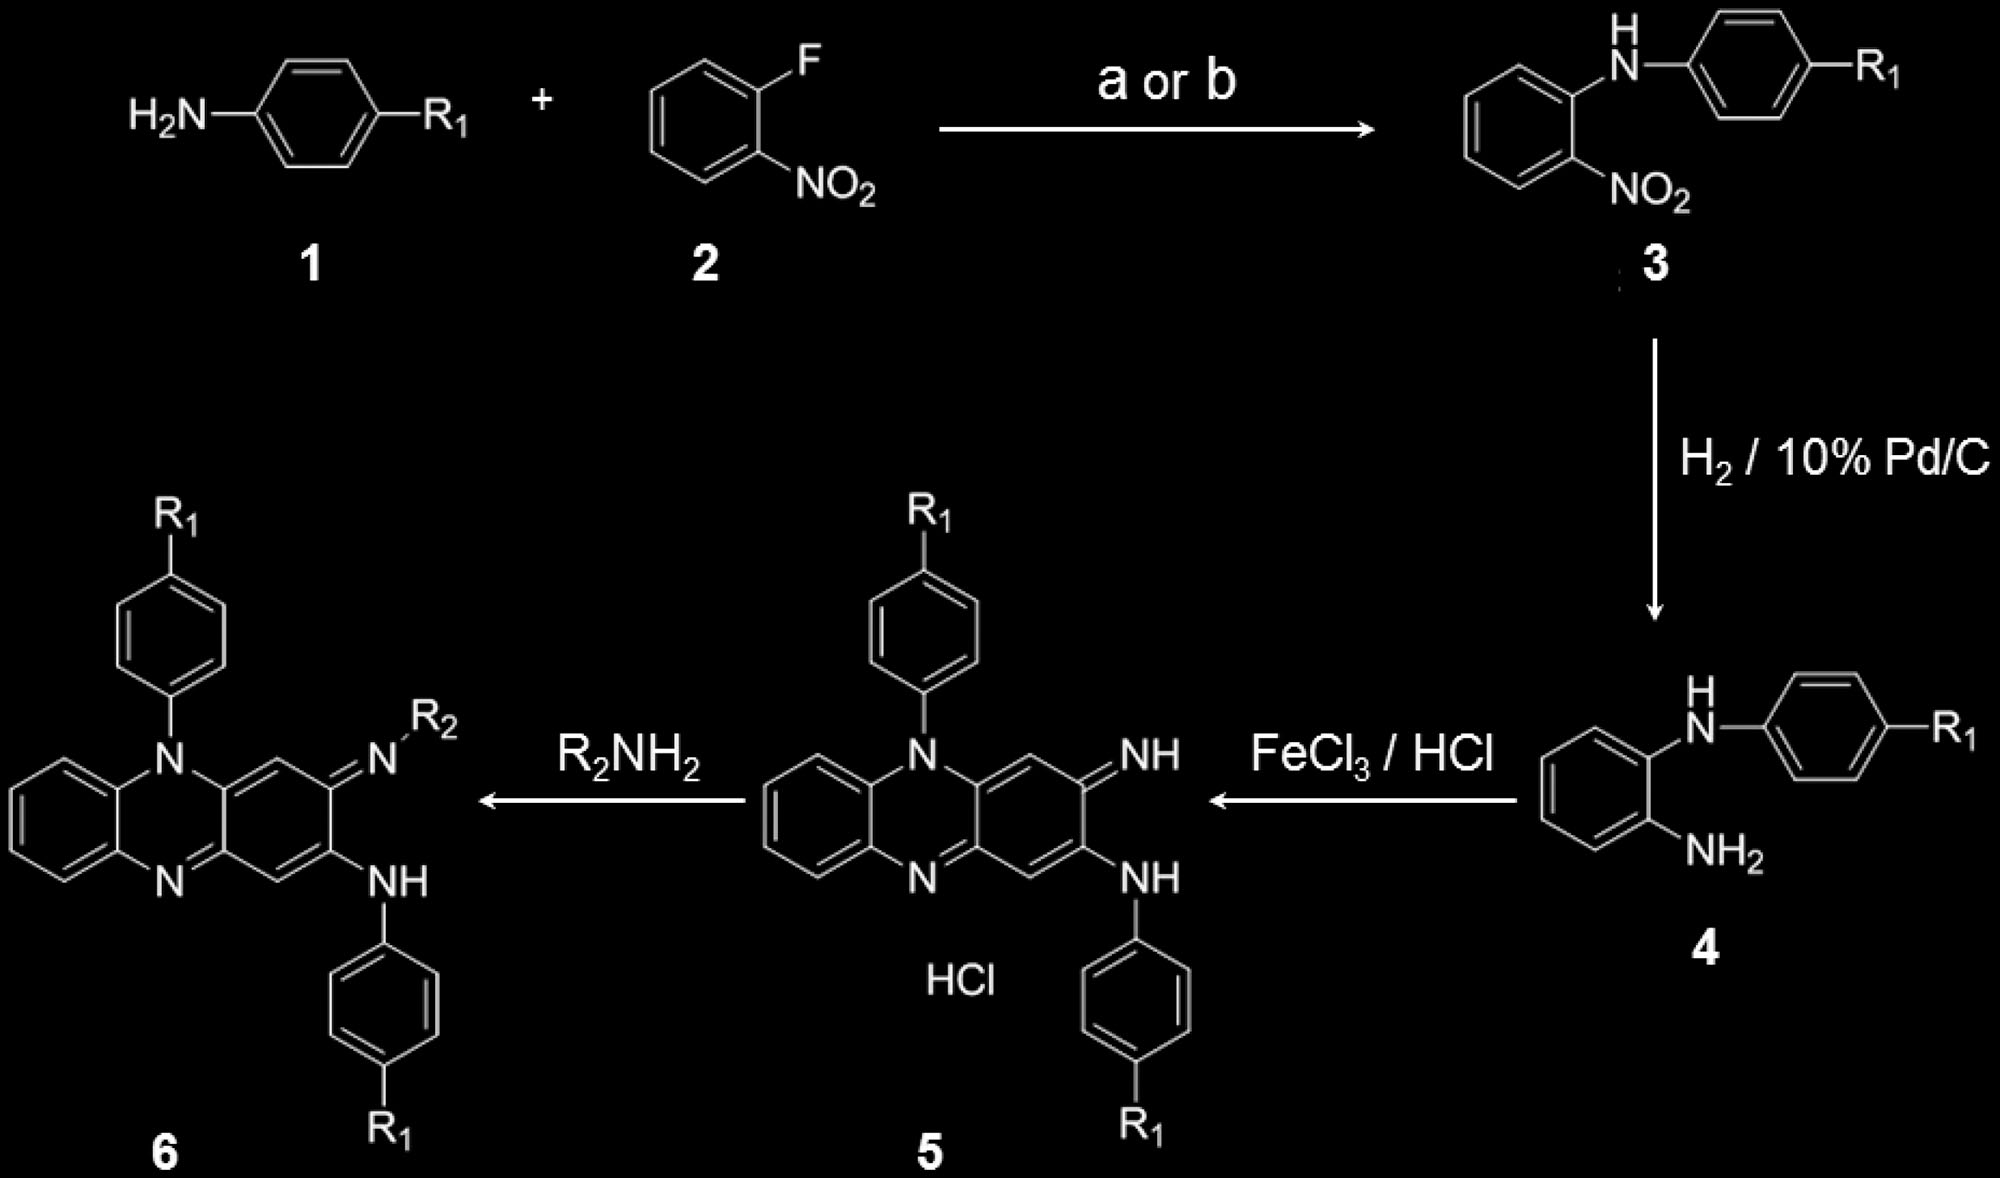
Scheme 1. Synthesis of phenazine derivatives. Treatment of aniline derivatives 1 with 2-fl uoronitrobenzene 2 (using reagents: a) KF/K 2 CO 3 or
b) KOH/DMSO) gave the secondary amine derivatives 3 in 22–63% yield. Reduction of the nitro group was carried out using 10% Pd/C catalyst under
hydrogen atmosphere to yield the diamine 4 in 55–99% yield. Then the diamine 4 was oxidized in aqueous ferric chloride solution to give the cor-
responding phenazine salts 5 in 70–96% yield. The phenazine salts 5 on treatment with variety of primary amines gave the corresponding phenazine
derivatives 6 in 10–85% yield. These methods are elaborated in detail in the Supporting Information.
1500025 (2 of 11)
2015 The Authors. Published by WILEY-VCH Verlag GmbH & Co. KGaA, Weinheim
Adv. Sci. 2015, 2, 1500025


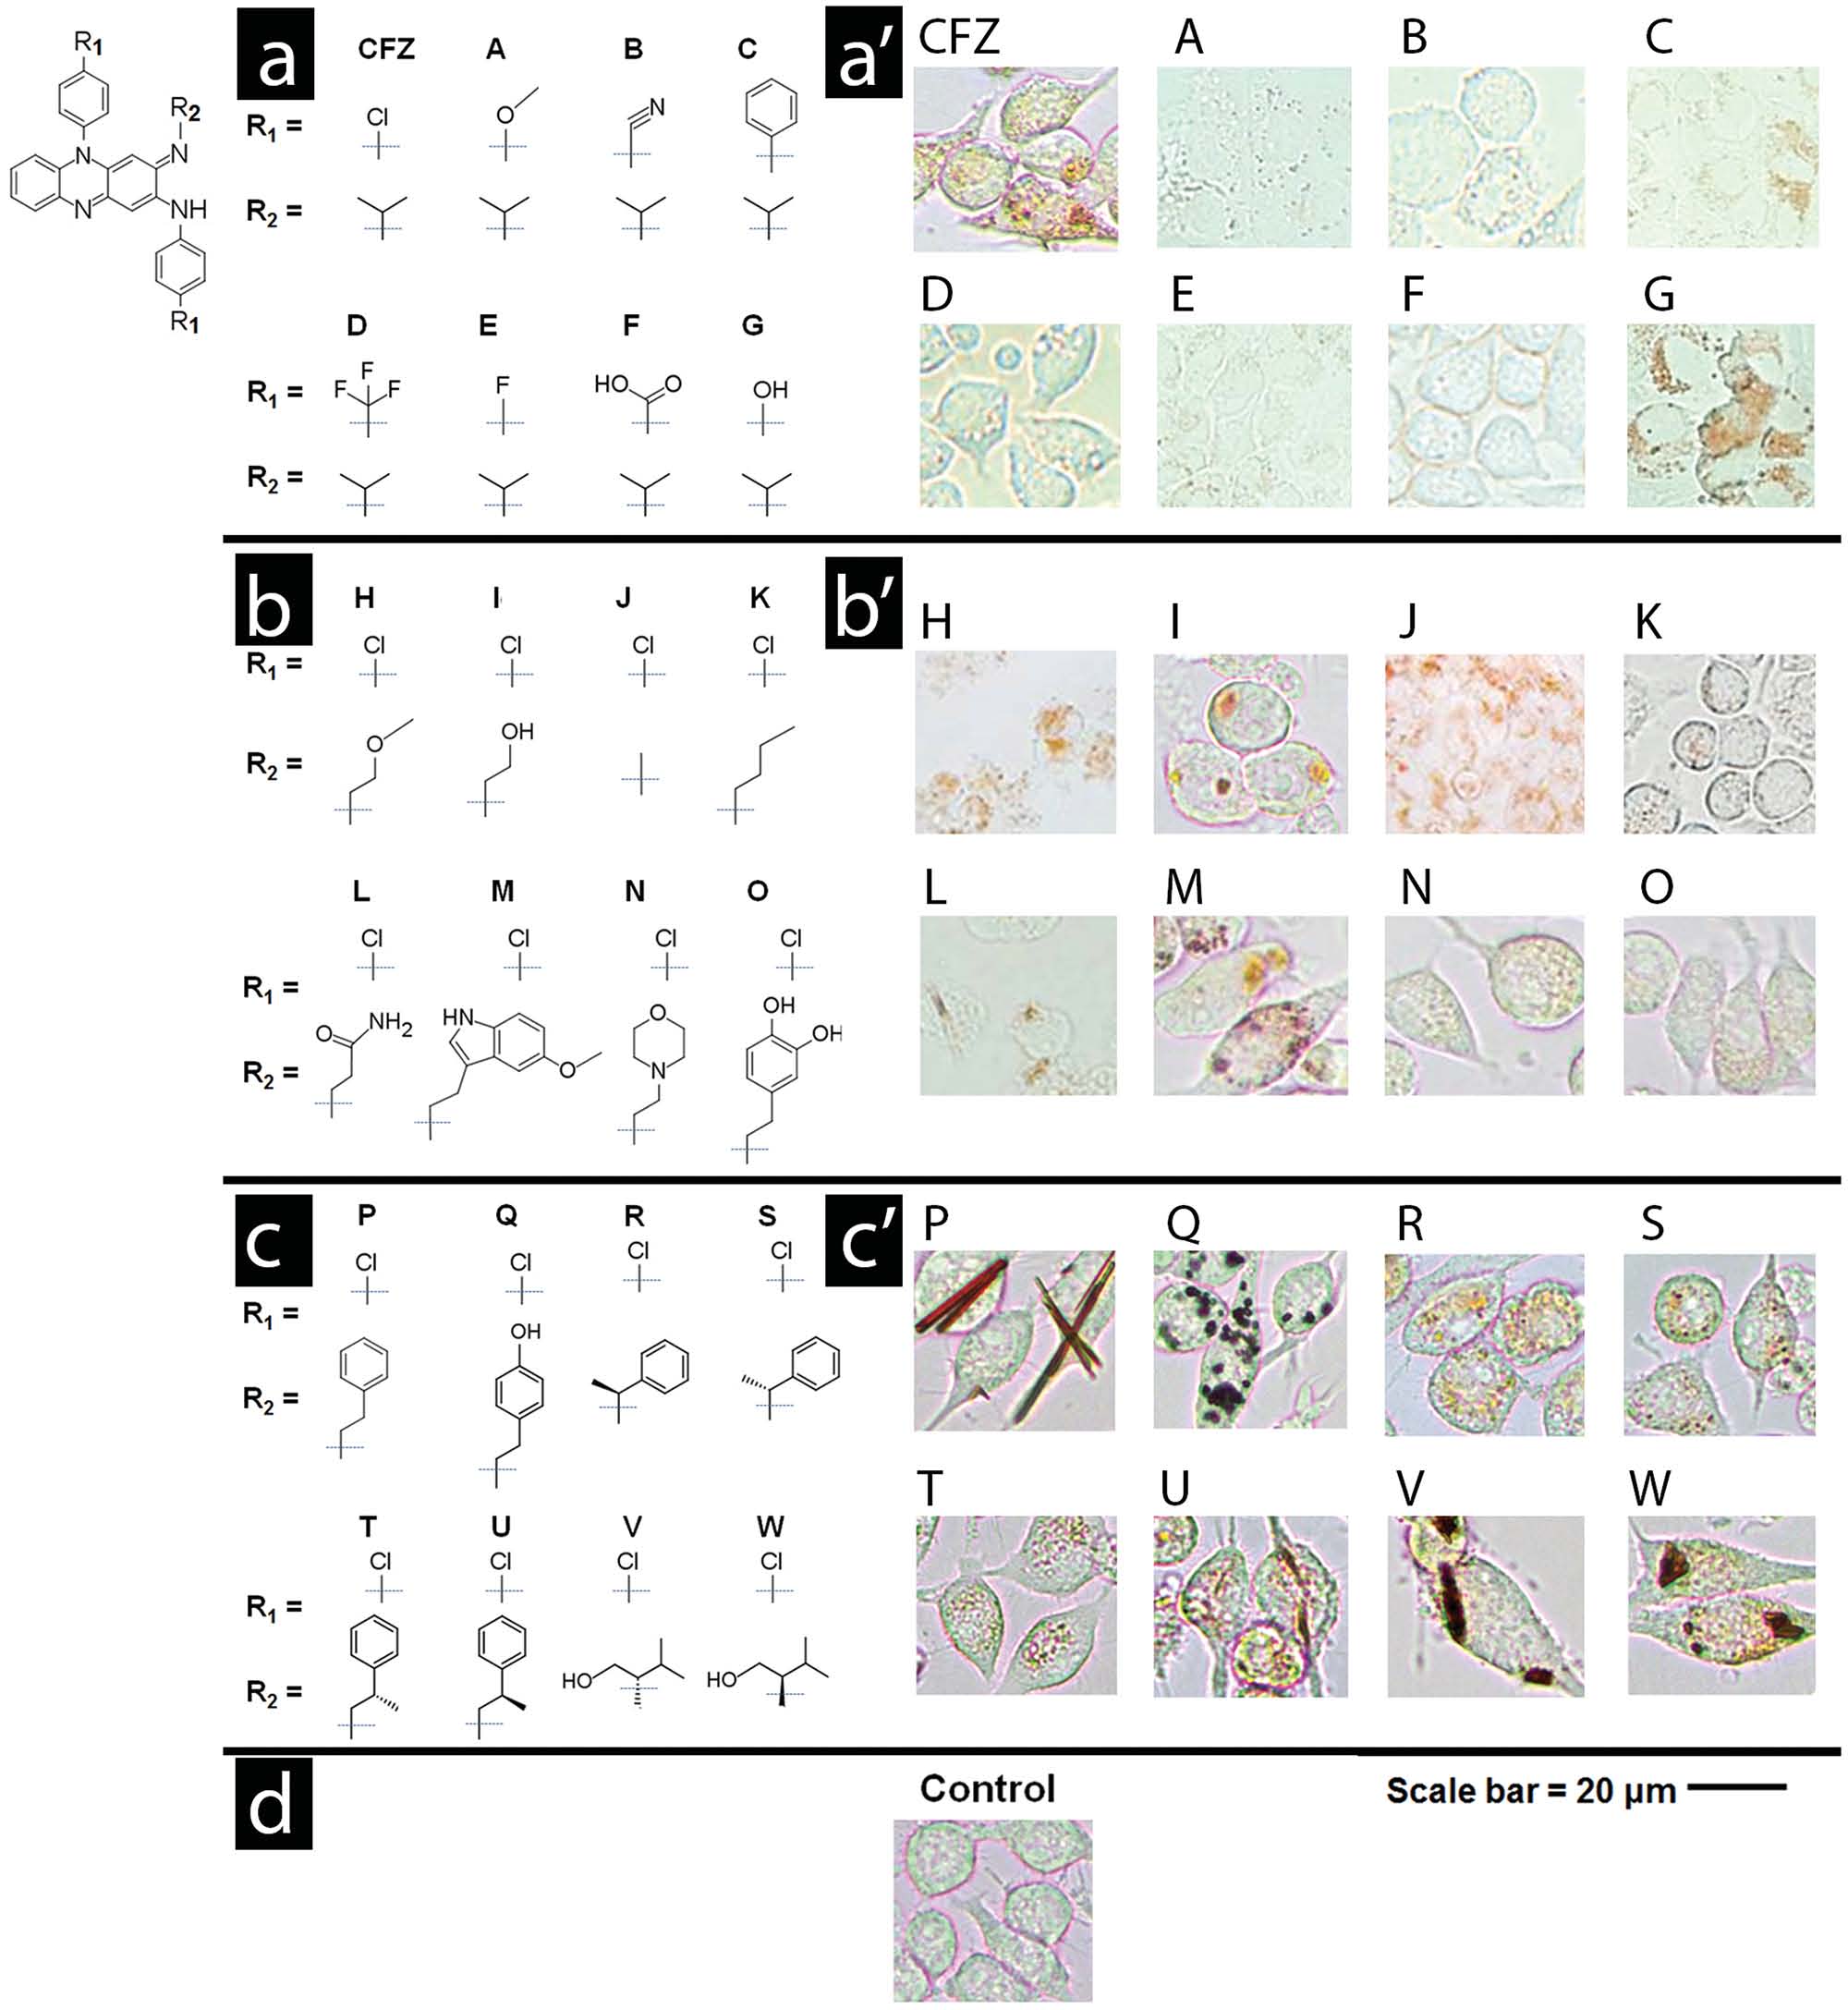
Figure 1. Three series of phenazine derivatives of clofazimine were synthesized to probe the relationship between clofazimine's chemical structure
a–c) and its cellular staining patterns a′–c′). The common phenazine core shared by all phenazine compounds is shown in the top left corner of the
fi gure. In the fi rst series of derivatives a,a′), the chlorophenyl groups of clofazimine were substituted with different functionalities. In the second series
b,b′), the isopropyl R-imino group of clofazimine was substituted with achiral functional groups. In the third series c,c′), the isopropyl R-imino group
of clofazimine was substituted with additional functional groups that probed the effects of an added stereochemical center. Scale bar = 20 µm.
isopropyl group with other functional groups at the R-imino
and Table S5, Supporting Information, Compounds R–W). As
position generally led to similar or greater staining of mac-
observed in the second series of achiral R-imino phenazines,
rophages (Figure 1 b′ and Table S4, Supporting Information, small variations in the chemical structure and physicochem-Compounds H–Q). Three derivatives yielded cellular staining
ical properties of these chiral R-imino phenazine compounds
patterns comparable in morphology and intensity to those of
led to pronounced differences in cellular staining (Figure 1 c′
clofazimine (Compounds H, I, and M) while two derivatives
and Table S6, Supporting Information). Three of the six chiral
yielded more prominent staining patterns (Compounds P and
R-imino derivatives exhibited prominent cellular staining,
Q). The most intense staining was associated with the forma-
associated with the formation of yellow, orange, red, or brown
tion of condensed cytoplasmic inclusions, either amorphous or
cytoplasmic inclusions (Figure 1 c′ and Table S6, Supporting
crystal-like in morphology (Figure 1 b′ and Table S4, Supporting
Information, Compounds U, V, and W). In control experi-
Information; Compounds P and Q).
ments, untreated cells showed no visible yellow or brown
To assess the extent to which specifi c interactions with staining when viewed using the same optical set up under
chiral components present in cells (or the cell culture medium)
transmitted, brightfi eld illumination (Figure
affected the bioaccumulation and self-organization behavior Furthermore, staining was also not observed when cells were of the compounds, we proceeded to synthesize and screen a
fi xed prior to incubation with the compounds (Table S6, Sup-
third, focused series of phenazine derivatives, which incorpo-
porting Information), indicating that the observed staining pat-
rated a stereochemical center at the R-imino position (Figure 1 c
terns refl ected underlying differences in physiological, small
Adv. Sci. 2015, 2, 1500025
2015 The Authors. Published by WILEY-VCH Verlag GmbH & Co. KGaA, Weinheim
(3 of 11) 1500025
anisotropy signals in association with dense inclusions formed specifi cally by phenazine compounds (see Compounds P, U,
V, and W in Figure 3 ). Interestingly, Compounds U, V, and W
exhibited optically anisotropic inclusions only in macrophages,
whereas Compound P formed optically anisotropic inclusions
in both macrophages (Figure 3 a) and epithelial cells (Figure 3 b).
By visual inspection, we observed signifi cant variations in the
molecular organization of the inclusions formed by different compounds: Some compounds formed monolithic aggregates comprised of a single domain with uniform orientation (Com-pound P; Figure 3 a,b), while other compounds formed complex aggregates comprised of segregated domains with subdomains organized in different directions (Compounds U, V, and W; Figure 3 a).
We quantitatively confi rmed that Compounds P and Q
showed higher diattenuation anisotropy in both macrophages and epithelial cells than seen with clofazimine (
Figure 4 a).
Notably, chiral Compounds U, V, and W exhibited even higher anisotropy as compared to clofazimine but only in macrophages (Figure 4 a). The measured diattenuation anisotropy signals for all chiral compounds were well above the background, diattenua-tion anisotropy signal of untreated cells (Figure 4 a). On average, the anisotropy diattenuation ratio measured at a wavelength of 546 nm relative to 623 nm did not reveal signifi cant wavelength-dependent differences in diattenuation anisotropy (Figure 4 b), although some compounds exhibited higher variability in the measured diattenuation anisotropy ratios in macrophages than in epithelial cells (Figure 4 ; Compounds V and W).
In relation to the compounds' chemical structures, the self-
assembly and resulting optical properties of intracellular struc-
Figure 2. Absorbance spectra of phenazine compounds were very similar
tures formed by phenazine compounds appeared to be highly
to that of clofazimine. Absorption peaks were between 450 and 490 nm
idiosyncratic: only one pair of enantiomers (Figure 3 and 4 a,
when measured in methanol and between 510 and 540 nm when meas-
Compounds T and U) exhibited enantioselective differences
ured in H 2 SO 4 .
in their optical anisotropy signal and this was observed only in macrophages. Compunds V and W did not show enantioselec-
molecule transport mechanisms present in live cells. Because
tive differences in diattenuation anisotropy ( Figure 5 a,b). The
all phenazine compounds exhibited similar absorbance spectra
other pair of enantiomers (Compounds R and S) did not yield
under different conditions ( Figure 2 a,b), the variations in cel-
a measurable, diattenuation anisotropy signal in either mac-
lular staining patterns most likely refl ected differences in the
rophages or epithelial cells. Furthermore, Compound P, an
accumulation and distribution of the compounds in the cells,
achiral phenazine compound, formed inclusions with strong
independently from the compounds' optical properties.
diattenuation anisotropy signals in both macrophages and epi-
Next, we proceeded to characterize the optical properties of
thelial cells (Figure 3 and 4 ), indicating that the formation of
the inclusions using a quantitative, polarization microscope [ 9 ] to
ordered, R-imino phenazine aggregates can occur regardless of
perform diattenuation anisotropy measurements on cells incu-
stereochemistry.
bated with the different compounds. [ 10 ] By transmitting linearly
To confi rm the intracellular localization of the inclusions, we
polarized, monochromatic light of wavelengths near the absorb-
took advantage of the fl uorescence properties of the phenazine
ance maxima of the phenazine molecules, the diattenuation ani-
Compounds P, T, and U. Following intracellular accumulation,
sotropy signal can be used to detect and quantify the presence
these compounds exhibited strong fl uorescence excitation and
of ordered aggregates of phenazine molecules in live cells. For
emission signals that were visible through the standard (tetra-
isotropic, disordered intracellular inclusions, polarized light is
methylrhodamine isothiocyate) TRITC channel of a fl uores-
expected to be transmitted in the same manner irrespective of
cence, confocal microscope. Accordingly, we acquired confocal
the orientation of the polarization vector, resulting in diattenu-
optical sections through cells incubated with these compounds
ation anisotropy close to 0. For ordered intracellular inclusions
to confi rm that the inclusions were intracellularly localized
of phenazine molecules (as occurs when molecules are aligned
(Figure 5 ). For counterstaining, cells were also incubated with
with each other), the diattenuation anisotropy should increase,
an orthogonally fl uorescent nuclear marker (Hoechst 33342), as
as the ordered molecular aggregates will preferentially transmit
well as an orthogonally fl uorescent, plasma membrane-specifi c
light that is polarized in a particular direction. Accordingly, by
marker (FM-143). FM-143 yielded a green, plasma membrane
comparing the diattenuation anisotropy image maps for treated
signal in the fl uorescein isothiocyanate (FITC) channel of the
and untreated control cells, we observed clear diattenuation
microscope, while Hoechst 33342 yielded a blue, nuclear signal
1500025 (4 of 11)
2015 The Authors. Published by WILEY-VCH Verlag GmbH & Co. KGaA, Weinheim
Adv. Sci. 2015, 2, 1500025
and epithelial cells (Figure 7 ), the PCA plot indicates that most of the observed variation was associated with cell type specifi c differ-ences in bioaccumulation and diattenuation
anisotropy, without a clear association with chirality, chemical structure or the lipophi-licity of the compounds.
Finally, we tested whether the bioaccumu-
lation of the compounds was related to the
precipitation of the compounds in cell culture
media or to their solubility. In serum con-
taining media, solutions of clofazimine and
the other phenazine compounds were stably
solubilized at the concentrations that were
added to the cells, so the formation of extra-
cellular precipitates is an unlikely explanation
for the measured differences in bioaccumu-
lation in either macrophages ( Figure 8 a) or
epithelial cells (Figure 8 b). Only one of the
phenazine analogs (Compound J) was not
completely solubilized under these condi-
tions. In the absence of serum (Figure 8 c,d),
Figure 3. Quantitative polarization microscopy of macrophages and epithelial cells incubated
the phenazine compounds exhibited signifi -
with the different phenazine compounds revealed cell type-specifi c differences in transmittance,
cant variation in their solubility with some of
diattenuation anisotropy, and the orientation of the polarization axis maximal transmittance
the compounds precipitating in the media.
of the intracellular inclusions. For the experiments, live RAW264.7 macrophages a) or MDCK
However, the solubility of the compounds
epithelial cells b) were incubated for 72 h with clofazimine or other phenazine analogs and
did not show a correlation with the measured
analyzed with the diattenuation anisotropy microscope imaging set up, using monochromatic light of 546 nm wavelength. Transmittance corresponds to the image map of the transmitted
bioaccumulation in macrophages (Figure 8 c)
light intensity at 546 nm wavelength (white corresponds to 100% transmittance and black
or epithelial cells (Figure 8 d).
corresponds to 0% transmittance) and orientation corresponds to the measured direction of
Considering the biological mechanisms
maximal light transmittance of linearly polarized light across the sample, indicated with a grid
that may account for the observed variations
of red lines superimposed on the image. Diattenuation corresponds to the quantitative diat-
in bioaccumulation properties of phenazine
tenuation anisotropy image map measured using linearly polarized light of 546 nm wavelength.
compounds, clofazimine and other small
The color-gradient calibration bar corresponds to diattenuation anisotropy values ranging from
molecule drugs can be subject to chemical
0 to 0.6. Scale bar = 20 µm.
transformation by metabolic enzymes. Fur-
in the 4′,6-diamidino-2-phenylindole (DAPI) channel. In both
thermore, small organic molecules can also be substrates of
macrophages and epithelial cells, optical sections through the
active transport mechanisms. These metabolic and active trans-
cells clearly revealed that Compounds P, T, and U (red signals)
port mechanisms are differentially expressed in macrophages
were localized at the periphery of the cell nuclei (blue signal)
and epithelial cells and they are highly specifi c and sensitive to
and within the confi nes of the cells' plasma membrane (green
the presence of different functional groups on the compounds.
signal) (Figure 5 ).
To establish the extent to which the differences in staining
and self-assembly of phenazine compounds may be due to
3. Conclusion
cell type-dependent differences in bioaccumulation, the total amount of compounds present in macrophages (
Figure 6 a)
To conclude, our results demonstrate that, in addition to clo-
and epithelial cells (Figure 6 b) following an incubation period
fazimine, other membrane-permeant small molecule phena-
was measured and normalized by the number of cells. Overall,
zine compounds can bioaccumulate and self-assemble in
phenazine compounds tended to accumulate more in mac-
macrophages, to a greater extent than in epithelial cells. Our
rophages than in epithelial cells, regardless of ordered aggre-
results also demonstrate the use of monochromatic polarized
gate formation (Figure
c). Nevertheless, compounds that light to measure diattenuation for monitoring the formation of
exhibited the greatest accumulation in macrophages (Figure
ordered, insoluble complexes, which can be useful for assaying
6 c,d) also yielded the most ordered inclusions (Compounds P,
intracellular self-assembly of phenazine compounds. This is an
Q, U, V, and W). To confi rm the cell type-dependence of the bio-
advantage of this approach compared to other types of optical
accumulation and intracellular self-assembly properties of the
techniques that have been developed to detect the presence of
phenazine compounds, principal component analysis (PCA)
insoluble drug complexes inside cells. [ 16 ] Indeed, with the quan-
was performed on the cumulative bioaccumulation and diatten-
titative polarization microscope, the presence of ordered molec-
uation anisotropy data ( Figure 7 ). Because the fi rst two compo-
ular aggregates accompanying bioaccumulation of phenazine
nents of the resulting PCA plots captured >97% of the variation
compounds was readily measurable and analyzable. Indepen-
in the measured properties of the compounds in macrophages
dently, we confi rmed the bioaccumulation of the molecules by
Adv. Sci. 2015, 2, 1500025
2015 The Authors. Published by WILEY-VCH Verlag GmbH & Co. KGaA, Weinheim
(5 of 11) 1500025
is far greater than one would expect from a nonspecifi c par-titioning or a specifi c binding mechanism. For all the com-
pounds that bioaccumulated inside cells, the measured num-bers of phenazine molecules per cell (>0.03 ± 0.01 picomoles) exceeded the amounts of the most concentrated, endogenous biomolecules and metabolites (e.g., adenosine triphosphate [ 11 ] or glutathione. [ 12 ] Only potassium and water are expected to
be present in greater amounts. [ 13 ] Considering the possibility that bioaccumulation may refl ect the partitioning of the mol-ecules in membranes, there are in the order of 15 picograms of total lipids per leukocyte. [ 14 ] This corresponds to 0.03 pico-moles of total lipids per cell (calculated based on 500 g mol −1 of phospholipid). Interestingly, such intracellular precipitation behavior has been reported for other kinds of drugs. [ 15 ] In fact, the size, faceted shapes, and overall morphology of these inclu-sions are inconsistent with the typical size, shapes and mor-phology of natural organelles [ 16 ] and do not resemble the typical staining patterns of mitochondria [ 17 ] or other cellular compo-nents stained with fl uorescent probes. [ 18 ] Therefore, one can infer that in addition to cell type-specifi c differences in bioaccu-mulation, the propensity of poorly soluble phenazine molecules to aggregate into insoluble molecular complexes and phase sep-
Figure 4. Quantitative comparison of the diattenuation anisotropy meas-
arate from other cellular components also exerts an important
urements of intracellular inclusions formed by clofazimine and other
infl uence on their intracellular disposition properties.
phenazine derivatives showing the most prominent diattenuation anisot-ropy signals (Compounds P, U, V, and W). Compound T was included as well, since it corresponds to the mirror image (chiral pair) of Compound U. a) Compared to clofazimine, Compounds U, V, and W show stronger
4. Experimental Section
diattenuation anisotropy signals in macrophages, while Compound P
Materials for Chemical Synthesis : The starting materials, reagents,
shows stronger diattenuation anisotropy signals in both macrophages
and solvents for the synthesis were purchased from Sigma Aldrich,
and epithelial cells. b) The ratio of 623 nm/546 nm diattenuation anisot-
Fisher Scientifi c Acros, Oakwood Products or Chem-Impex and
ropy signals of the phenazine compounds was similar to that of clofazi-
used as such without purifi cation. Biotage Initiator Classic, single-
mine. Suggesting greater variability in the organization of the intracellular
mode Microwave Synthesizer was used for Microwave Syntheses.
inclusions, Compounds V and W exhibited greater standard deviations,
Compounds were purifi
ed by either Column Chromatography
corresponding to greater differences in the measured diattenuation ani-
using Silicycle's SiliaFlash P60 (220–240 mesh) under positive
sotropy ratios amongst individual inclusions.
house nitrogen pressure or Silicycle or Biotage prepacked fl ash
chemical analysis and the intracellular localization of the inclu-
columns using Biotage SP1 Flash System using two solvent gradient system. Solvent/Reagent Abbreviations or Formulae used: DCM,
sions was confi rmed with confocal microscopy by taking advan-
dichloromethane; EtOH, ethanol; EtOAc, ethyl acetate; DMSO,
tage of the compounds' fl uorescence signals.
dimethylsulfoxide; MeCN, acetonitrile; AcOH, acetic acid; K
Similar to other structure–property relationship studies, our
potassium carbonate; KF, potassium fl uoride; Na 2 SO 4 , sodium sulfate;
results demonstrate how the molecular organization of self-
KOH, potassium hydroxide; FeCl 3 , ferric chloride; HCl, hydrochloric
assembling intracellular elements can be analyzed in relation
acid; Pd/C, palladium on carbon. NMR spectra were recorded on
to specifi c chemical features of the individual, small molecule
either Varian MR 400 MHz, or Varian Inova 500 MHz spectrometer.
building blocks. Based on staining patterns, the uptake of clofa-
Chemical shifts were reported in δ (parts per million) in reference to the hydrogen peaks of tetramethylsilane, δ = 0.00. Mass spectra were
zimine was inhibited by replacing its chlorophenyl group with
recorded on a Micromass LCT Time-of-Flight instrument utilizing
different aromatic functionalities. Notably, modifi cation of the
electrospray ionization in the positive ion mode (ESI + ).
R-imino group did not suppress intracellular inclusion forma-
Synthesis of Phenazine Derivatives : Scheme 1 represents the overall
tion. Instead, several R-imino phenazine derivatives exhibited
synthesis procedures of the phenazine compounds. With the previously
greater bioaccumulation than clofazimine, forming highly con-
reported methods (using reagents, (a) KF/K
densed cytoplasmic inclusions, which exhibited strong diattenu-
DMSO), [ 19 ] aniline derivatives 1 and 2-fl uoronitrobenzene 2 were treated
to produce the secondary amine derivatives 3 ( N -(4-aryl)-2-nitroaniline).
ation anisotropy signals. In addition, biological factors affecting
Using 10% Pd/C catalyst under hydrogen atmosphere, the nitro group
the preferential bioaccumulation of phenazine molecules in
in 3 was reduced to yield the diamine 4 ( N -arylbenzene-1,2-diamine).
macrophages exerted the most dominant effect on self-organi-
Then, derivative 4 was oxidized [ 20 ] in aqueous ferric chloride solution
zation and intracellular inclusion formation, independently of
to produce the corresponding phenazine salts 5 (3-imino- N ,5-bis(aryl)-
the lipophilicity, solubility, and chirality of the molecules.
3,5-dihydrophenazin-2-amine hydrochloride). Following treatments with
The condensation and phase separation of phenazine com-
various primary amines, the phenazine salts 5 yielded the corresponding
phenazine derivatives
pounds into insoluble aggregates especially infl uences the
dihydrophenazin-2-amine) with 10%–85% yield.
bioaccumulation and retention of these compounds inside
Absorbance Measurements
: Phenazine derivatives were solubilized
macrophages. In this regard, it is important to note that the
at 0.1 mg mL −1 in methanol and in 9 M H 2 SO 4 . The UV–vis spectra of
measured concentration of phenazine compounds inside cells
the different phenazine derivatives in methanol and in acidic solutions
1500025 (6 of 11)
2015 The Authors. Published by WILEY-VCH Verlag GmbH & Co. KGaA, Weinheim
Adv. Sci. 2015, 2, 1500025
Figure 5. Confocal fl uorescence microscopy of RAW264.7 macrophages or MDCK epithelial cells after incubation with fl uorescent phenazine Com-
pounds, P, T, or U. 2D images in xy planes show the location of cell nuclei (blue) and plasma membranes (green), together with the corresponding,
intracellular location of phenazine compounds (red). 3D reconstructions of optical sections through orthogonal planes ( xz and yz planes) confi rm
intracellular, cytoplasmic signals of compounds (red), in relation to the position of the nuclei and plasma membrane signals. Scale bar = 20 µm.
of H 2 SO 4 were obtained in 96 well plates, using a Biotek microplate
Culture Collection (ATCC) (Manassas, VA) and cultured in 75 cm
spectrophotometer.
fl asks at 37 °C, 5% CO 2 containing humidifi ed incubator. RAW264.7
Physicochemical Property Predictions
: Estimation of various macrophages (passage numbers 5–15) were grown in the medium
physicochemical properties of clofazimine and its chemical derivatives
containing Dulbecco's Modifi ed Eagle Medium (DMEM (Gibco 11145);
which could be important for predicting their behaviors when those
Invitrogen, Carlsbad, CA) with 2 × 10 −3 M L -glutamine, 4500 mg L −1 of
chemicals are confronted by cellular/suborganellar membranes were
d-glucose, 110 mg L −1 of sodium pyruvate, 1% penicillin–streptomycin
made as follows: Clog P (the calculated logarithm of lipid/water
(Gibco 10378), and 10% fetal bovine serum (FBS; Gibco 10082).
partitioning coeffi cient of nonionic (neutral) forms of the compound)
Confl uent macrophage cells were detached by scraping and subcultured
were calculated by Chemaxon software from Marvin Beans (http://www.
at 1:8 split ratios to culture fl asks. MDCK cells (passage numbers 60–80)
chemaxon.com/marvin). Clog P values of ionized species were calculated
were cultured with growth medium consisting of DMEM supplemented
using the procedures described by Hansch and Leo. [ 21 ] Multiple p K a
with 1X nonessential amino acids (Gibco 11140), 1% penicillin–
(the dissociation constant of the protonated functional group) values
streptomycin, and 10% FBS. After reaching 70–80% confl uence,
(p K a1 , p K a2 , or p K a3 ) were calculated for the ionizable functional groups
MDCK cells were detached from the culture fl asks using trypsin-
(amines) in these weakly basic molecules. Other structure parameters
ethylenediaminetetracetic acid (trypsin-EDTA) solution and subcultured
were estimated as described in the next section. [ 22 ]
at a split ratio of 1:5. Media in the fl ask was replaced every 3 d.
Predicting Cellular Uptake and Intracellular Localization of Phenazine
Solubility Measurements
: Solutions containing the phenazine
Compounds : Intracellular localization was predicted for each plausible
derivatives were made in cell culture media (DMEM) with or without
ionic species of each phenazine compound as follow. For each species,
FBS (10%). After a 24 h incubation, the solutions were centrifuged
structure parameter values, as estimated above, were inserted into
(10 000 × g , 10 min), the supernatant was removed and the precipitate
published quantitative structure activity relationship (QSAR) models
was dissolved in 9
. The supernatant was diluted with
predicting cell uptake and intracellular localizations.
10 M NaOH to precipitate the remaining solubilized compound. The
moderate-good predictions in Tables S1, S3, and S5 (Supporting
diluted supernatant was centrifuged (10 000 × g , 10 min) followed
Information) relate to the Clog P of the major species present, usually
by dissolution of the precipitate in 9
. Both fractions
the free base, as follows:
were spectrophotometrically measured with a Biotek microplate
Poor: Clog P > 8 or Clog P < 0 [and/or number of rotatable bonds >
spectrophotometer ( λ = 540 nm) and phenazine content was determined
40]; moderate: 8 > Clog P > 5; Good: 5 > Clog P > 0.
using calibrated clofazimine standards.
Species close to prediction boundaries in parameter space are
Cytotoxicity Measurements
: A 3′-bis(4-methoxy-6-nitro)benzene-
indicated by use of terms such as moderate-good [i.e., the species falls
sulfonic acid hydrate (XTT) colorimetric assay was performed to assess
into the moderate zone but close to the boundary with the good zone].
the cytotoxicity of the clofazmine derivatives in RAW264.7 macrophages
Predictions assume that p K a values of basic groups are such that for
or MDCK epithelial cells using a Cell Proliferation Kit II (Roche
most analogues a large proportion of each compound will be present
Chemicals, Indianapolis, IN). Briefl y, the cells were seeded in 96 well
in solution as a free base, with rather less as monocations, and even
plates at a cell density of 8 × 10 3 cells cm −2 (RAW264.7 macrophages) or
less as polycations, under physiological conditions. Polycations would
1.5 × 10 4 cells cm −2 (MDCK epithelial cells) and after a 24 h incubation
only be present within acidic organelles. In Tables S1, S3, and S5
), cells were exposed to media containing various
(Supporting Information): E = endoplasmic reticulum, C = cytosol, G =
concentrations of clofazmine or its chemical derivatives (100 µL of
generic biomembranes, L = lysosome, M = mitochondrion, P = plasma
Cell Culture : RAW264.7 macrophages or MDCK (Madin Darby Canine
(no phenol red; Gibco 21063) with 5% FBS and 1 × 10 −3 M sodium
Kidney) epithelial cells (strain II) were obtained from American Type
pyruvate. After 72 h incubation with clofazmine or its derivatives,
Adv. Sci. 2015, 2, 1500025
2015 The Authors. Published by WILEY-VCH Verlag GmbH & Co. KGaA, Weinheim
(7 of 11) 1500025
Figure 6. Measured differences in the accumulation of clofazimine or its phenazine derivatives (in pmols per cell) in RAW264.7 macrophages or MDCK
epithelial cells following a 72 h incubation period. a) Measurements indicate signifi cant differences in the accumulation of the compounds in live versus
fi xed macrophages. b) Measurements also indicate signifi cant differences in the accumulation of the compounds in live versus fi xed epithelial cells.
c) Plot of mass accumulation of compounds in macrophages versus epithelial cells reveals overall trend towards higher accumulation of the com-
pounds in macrophages. d) Plot of the cellular accumulation of phenazine compounds in macrophages and epithelial cells in relation to the diattenu-
ation anisotropy of the resulting intracellular inclusions, measured using linearly polarized light at 546 nm wavelength.
compound-containing media was removed and cells were washed twice
epithelial cells were seeded in the 8-well Nunc Lab-Tek II chambered
with media. The XTT labeling reagent (3′-bis(4-methoxy-6-nitro)benzene-
(#1.5) coverglasses (Thermo Scientifi c, Pittsburgh, PA) at a cell
sulfonic acid hydrate) was freshly mixed with the electron coupling
density of 8 × 10 3 cells cm −2 or 1.5 × 10 4 cells cm −2 , respectively.
-methyl dibenzopyrazine methyl sulfate) before use
After a 24 h incubation (37 °C, 5% CO 2 ), cells were incubated with
according to the manufacturer's instructions. Cells were incubated in
solution of clofazmine or its chemical derivatives (300 µL of 5 × 10 −6 m
100 µL of media (DMEM with 5% FBS) with XTT labeling mixture for
concentration; measured cell viability ranging from 85% to 97% for all
3 h (37 °C, 5% CO 2 ). The absorbance value in each well was measured
compounds tested at this concentration; Figure 1 ) in DMEM (no phenol
at 495 nm against a reference wavelength at 650 nm using a microplate
red; plus 1 × 10 −3 M sodium pyruvate and 5% FBS). For Compound "I,"
reader (Synergy 2, BioTek Instruments, Winooski, VT). The experiments
2.5 × 10 −6 M of compound solution in media was used for the RAW
were repeated in three different sets for the various concentrations of
264.7 macrophages incubation because of lower cell viability at higher
compounds. The IC50 value for each compound was calculated from
concentrations (IC50 = (3.95 ± 0.11) × 10 −6 M ). A solution of clofazmine
the concentration-response curve generated by a nonlinear regression
or other chemical derivatives was made by a diluting stock solutions
(curve fi t) method in GraphPad Prism version 5.0 (GraphPad Software,
(2.5 × 10 −3 M in DMSO; 10 × 10 −3 M stock in DMSO were stored at −80 °C
Inc., San Diego, CA). The concentration of clofazimine or its chemical
for further use) into DMEM with 5% FBS. Previously, we reported that
derivatives used for further in vitro cell studies was determined based on
clofazmine did not form visible precipitates in this media (DMEM with
cell viability (%) assay results (see the next section).
5% FBS). [ 7 ] For other phenazine derivatives, precipitates were avoided
Cell Accumulation Experiments and Transmitted Light Microscopic
by including FBS in the media. The extracellular concentration of each
Examination
: For cell cultures, RAW264.7 macrophages or MDCK
compound in each well was maintained by daily replacement of the
1500025 (8 of 11)
2015 The Authors. Published by WILEY-VCH Verlag GmbH & Co. KGaA, Weinheim
Adv. Sci. 2015, 2, 1500025
incubation with the compounds. Cells were seeded on the chambered cover glasses at the density of 1.5 × 10
macrophages) or 2.5 × 10 4 cells cm −2 (MDCK epithelial cells). After an overnight incubation (37 °C, 5% CO 2 ), media was removed from the wells and cold methanol (−20 °C) was added to each well. After
30 s, remaining methanol was removed by washing with media with 5% FBS. Fixed cells were incubated (37 °C, 5% CO 2 ) with clofazmine or derivatives (300 µL of 5 × 10 −6 M ; 2.5 × 10 −6 M for I) in media with 5% FBS. After 72 h, fi xed RAW264.7 or MDCK cells were washed with media and examined using the same transmitted microscopy conditions as the live cells.
Cell Associated Mass Measurements
: RAW264.7 macrophages or
MDCK epithelial cells were seeded in 96 well plates at the density of
Figure 7. PCA confi rms that the cell-associated staining patterns of phen-
8 × 10 3 cells cm −2 or 1.5 × 10 4 cells cm −2 , respectively. After an overnight
azine compounds corresponded with a greater variation in bioaccumula-
incubation (37 °C, 5% CO 2 ), cells were incubated with 100 µL of the
tion and optical signals in macrophages. PCA was performed based on all
media (DMEM with 5% FBS) containing 5 × 10 −6 M clofazmine or its
optical properties analyzed for each phenazine compound in series 2 and
chemical derivatives (2.5 × 10 −6 M of Compound "I"). Media containing
3, using fi ve replicate measurements at 546 and 623 nm. In the plot, X(M)
each compound was replaced every day during the 72 h incubation.
corresponds to Compound X in macrophages (red) and X(E) corresponds
After the incubation, media was removed and cells were washed with
to Compound X in epithelial cells (blue). In this PCA plot, only the two
Hank's balanced salt solution (HBSS) buffer (No. 14025; Invitrogen)
main principal components are shown. These fi rst two components of the
twice. RAW264.7 macrophage cells in buffer were scraped and MDCK
PCA plot explained 97% of the variance in the data.
epithelial cells were exposed to Trypsin-EDTA solution for detachment from the plates for cell number counting and quantifi cation of cell-
compound-containing media. After 72 h of incubation with clofazmine
associated masses. After centrifugation (650 × g
), supernatant was
or its derivatives, compound-containing media were removed and cells
removed and cell pellets were resuspended in 0.1 M citric acid/0.1 M
were washed twice with media. Live cells in the chambered glasses
trisodium citrate buffer (pH 5) for cell counting as previously reported. [ 7 ]
were examined under inverted transmitted light microscopy (Nikon
Equal numbers of cells in 100 µL in buffer were transferred to 96 well
Eclipse T i microscope) with a 40× objective and color camera. As a
plates and 100 µL of detergent (ATCC, 30-1010K) was added into wells
control experiment, fi xed cells were also microscopically examined after
for cell lysis. Chemical absorbance from each well was measured by the
Figure 8. The solubility of phenazine compounds in cell culture media a,b) with FBS (+FBS) and c,d) without FBS (−FBS) plotted in relation to their
cellular accumulation in a,c) RAW264.7 macrophages and b,d) MDCK epithelial cells.
Adv. Sci. 2015, 2, 1500025
2015 The Authors. Published by WILEY-VCH Verlag GmbH & Co. KGaA, Weinheim
(9 of 11) 1500025
UV–vis microplate reader (Synergy 2, BioTek Instruments, Winooski,
calculate the average and differential transmittance and the orientation
VT) at 490 nm wavelength and cell-associated mass of each compound
of maximum transmittance in every resolved image pixel. To isolate
was calculated by a standard curve generated separately using the
and analyze quantitative data of the objects (crystals), the anisotropy
same media and presented as pmole/cell by normalizing the amount of
or maximum transmittance axis orientation image fi le opened in
chemical in each cell population sample by the number of cells in each
ImageJ was inverted (Ctrl + Shift + I) and thresholded using ImageJ's
default automatic method ("Binary" → "Convert to Mask"). By using
Linear Diattenuation Microscopy Instrument Set Up : The LC-PolScope
the ImageJ's algorithm, "Analyze Particles," data of anisotropy or
rst developed as a birefringence imaging system at the maximum transmittance axis orientation of objects in images could be
Marine Biological Laboratory (Woods Hole, MA) by Oldenbourg
obtained automatically. Diattenuation ratios were calculated by dividing
and colleagues, which greatly increased the sensitivity and analytic
anisotropy at 623 nm by that at 546 nm. For images obtained from cells
power of the polarized light microscope.
Recently, the technique
incubated with Compounds, P, U, V, or W, maximum transmittance axis
was extended to include quantitative imaging of diattenuation and
orientation lines in crystals were displayed by using OpenPolScope's
polarized fl uorescence in biological and man-made specimens.
plugin (Orientation-LinesV3) installed in ImageJ.
For our studies of absorption properties of intracellular aggregates
Confocal Fluorescent Microscopy : A Nikon A1 confocal microscope was
of phenazine derivatives, we used the diattenuation LC-PolScope
used for further investigation of live cells incubated with chiral pairs of
as reported earlier
[ 10 ] and described on the website OpenPolScope.
compounds (T and U) and the parent compound, P. Since crystals or
org. The optical design was built on a Nikon Eclipse T i microscope
vesicular forms containing chemicals inside the cells incubated with
equipped with the liquid crystal universal compensator consisting of a
Compound P, T, or U were fl uorescent when viewed with the TRITC
linear polarizer and a pair of liquid crystal devices. The LC compensator
fi lter sets, intracellular distribution of these compounds in RAW264.7
was part of the transillumination path and was used to illuminate
or MDCK cells were visualized using a Nikon A1 confocal microscopy
the specimen with monochromatic, linearly polarized light of varying
(Nikon Instruments Inc., Melville, NY) equipped with diode-based lasers
polarization orientation. There was no polarization analyzer present
and a Nikon Apo 60×/1.4 NA oil immersion lens. Briefl y, RAW264.7
in the imaging path. Quantitative intensity images were recorded by
macrophages or MDCK epithelial cells were seeded in the 8-well
a charge-coupled device camera and a desktop computer calculated
Nunc Lab-Tek II chambered (#1.5) cover glasses (Thermo Scientifi c,
the average transmittance, the differential transmittance and the
Pittsburgh, PA) at a density of 8 × 10 3 cells cm −2 (RAW264.7 cells) or
polarization orientation leading to maximum transmittance for each
1.5 × 10 4 cells cm −2 (MDCK cells) and allowed to adhere overnight
optically resolved picture element (pixel). Acquisition and processing
(37 °C, 5% CO 2 ). Then, 5 × 10 −6 M of Compound "P" or the related
steps were controlled using OpenPolScope plugins for the open source
isomers, "T" or "U" in DMEM with 5% FBS (300 µL) was added to the
imaging programs ImageJ and Micro-Manager (MMStudio version
cells and the cells were incubated for 72 h (37 °C, 5% CO 2 ). For live cell
1.4.15). With the combination of hardware and software, polarized light
imaging, after the removal of media, cells were washed with HBSS buffer
images were acquired at high sensitivity and high spatial resolution for
twice. Hoechst 33342 (Invitrogen, Carlsbad, CA) was used for staining
measuring linear diattenuation.
cell nuclei and FM 1-43 (Molecular Probes T35356, Invitrogen) for the
Linear Diattenuation Microscopy Data Acquisition and Analysis : After
plasma membrane. Cells were incubated with 300 µL of 1:1 (v/v) dye
RAW264.7 macrophages or MDCK epithelial cells were incubated with
mixtures of 5 µg mL −1 Hoechst 33342 and 7 × 10 −6 M FM 1-43 in HBSS
the compound in the chambered cover glasses for 72 h, at the same
for 15 min at room temperature. Without fi xative, the confocal imaging of
time of performing transmitted microscopic examination, cell specimens
the live cells was performed using lasers for DAPI (excitation/emission
were examined under linear diattenuation microscopy using the Nikon
wavelength: 405 nm/450 ± 25 nm), FITC (488 nm/525 ± 25 nm), and
Eclipse T i microscope with 40×/0.75 NA objective and monochromatic
TRITC (561 nm/596 ± 25 nm) channels. Z-stack images of the cells were
light of two different center wavelengths, 546 and 623 nm (passband
captured along the Z-axis (interval, 1 µm) in three fl uorescence channels
30 nm). In the OpenPolScope software, Pol-Acquisition and Pol-Analyzer
and analyzed by using the Nikon NIS-Elements 3.2 confocal software
plugins (version 2.0) were used to capture, process, and analyze
(Nikon Instruments Inc., Melville, NY). In 3D reconstructions of the
the attenuation images. Before imaging the samples, the setup was
confocal sections assembled with the Nikon software, the cell nuclei
calibrated using a specially prepared slide featuring four small pieces
fl uoresced in the Hoechst/DAPI channel; the cell membranes fl uoresced
of linear polarization fi lters. The transmission axes of the fi lters were
in the FITC channel; and, the intracellular inclusions fl uoresced in the
oriented in steps of 45° providing a means to calibrate the LC universal
compensator settings. After the calibration, a sample slide was inserted
Transmittance and Optical Density (OD) Calculations : For calculating
and fi rst a sequence of polarized light images of a clear, fully transmitting
the differential transmittance of the inclusions, images at four different
sample area was recorded, followed by an image sequence featuring
angles of polarization (0°, 45°, 90°, and 135°) were acquired by linear
the cells under investigation. The images of the clear area were used
attenuation microscopy as described above. To measure transmittance,
to determine instrument factors which were needed for computing the
a threshold was applied to the mean transmitted image generated by
average and the polarization dependent loss in transmittance in cellular
the linear attenuation microscopy data acquisition. This threshold was
components visible in the second image. [ 10 ]
determined using the ImageJ Auto-thresholding protocol—Moments.
Linear diattenuation is a material property that can occur in materials
Based on this threshold, a region of interest (ROI) image mask was
such as crystals, in which the light absorbing molecules are arranged
generated, and then used to measure the mean transmittance ( T mean )
with a preferred orientation. The molecular alignment creates principal
of the ROIs, expressed as mean pixel value. To generate transmittance
axes in the material denoting polarization directions for which light is
image maps and for quantitative measurement of transmittance, pixel
maximally and minimally transmitted. Diattenuation is the difference
values were converted to absolute values by dividing the mean pixel
between maximal ( T max ) and minimal ( T min ) transmittance, divided by
value by 255 (8-bit images). For the corresponding OD image maps and
their sum (Equation ( 1) ):
measurements, we used the following formula: OD = −log 10 ( T mean ). For each compound a total of fi ve images were measured from experiments performed on three separate days (>200 cells analyzed per compound).
Diattenuation = max − min
Principal Component Analysis
: An "optical properties score" was
calculated for each replicate measurement ( n = 5) for each compound in each cell type (RAW264.7 macrophages and MDCK epithelial
To simultaneously measure the attenuation of many crystals cells), by combining the anisotropy and optical density values at
with arbitrary orientations, we developed algorithms based on four
546 and 623 nm wavelengths. PCA plots [ 24 ] were generated using soft
specimen images, each recorded using light of a different polarization
independent modelling in class analysis (SIMCA, http://www.umetrics.
orientation: 0°, 45°, 90°, and 135°. [ 10 ] The four raw images were used to
com/products/simca; Umeå, Sweden).
1500025 (10 of 11) wileyonlinelibrary.com
2015 The Authors. Published by WILEY-VCH Verlag GmbH & Co. KGaA, Weinheim
Adv. Sci. 2015, 2, 1500025
Supporting Information
[7] J. Baik , G. R. Rosania , Mol. Pharm. 2011 , 8 , 1742 .
[8] a) A. Fahr , P. van Hoogevest , J. Kuntsche , M. L. Leigh ,
Supporting Information is available from the Wiley Online Library or
J. Liposome Res. 2006 , 16 , 281 ; b) A. Fahr , P. van Hoogevest , S. May ,
from the author.
N. Bergstrand , S. L. ML , Eur. J. Pharm. Sci. 2005 , 26 , 251 .
[9] a) R. Oldenbourg , Nature 1996 , 381 , 811 ; b) R. Oldenbourg , G. Mei ,
J. Microsc. 1995 , 180 , 140 ; c) M. Shribak , R. Oldenbourg , Appl. Opt.
Acknowledgements
2003 , 42 , 3009 .
[10] S. B. Mehta , M. Shribak , R. Oldenbourg , J. Opt. 2013 , 15 , 094007 .
The authors acknowledge fi
nancial support from NIH (Grant [11] I. Beis , E. A. Newsholme , Biochem. J. 1975 , 152 , 23 .
R01GM078200 to G.R.R. and R01EB002583 to R.O.), a Rackham
[12] C. Hwang , A. J. Sinskey , H. F. Lodish , Science 1992 , 257 , 1496 .
Predoctoral Fellowship Award to K.A.M., and University of Michigan
[13] a) H. Lodish , Molecular Cell Biology , W. H. Freeman and Company ,
M-Cubed funds awarded to K.A.S. and G.R.R.; R.W.H. thanks Dr. R. Aitken,
New York 2008 ; b) G. M. Cooper , R. E. Hausman , The Cell: A Molec-
School of Life Sciences, University of Glasgow for provision of facilities.
ular Approach , Sinauer Associates , Sunderland 2000 .
[14] a) E. L. Gottfried , J. Lipid Res. 1967 , 8 , 321 ; b) J. Machaiah , U. Vakil ,
Received: February 10, 2015
J. Biosci. 1989 , 14 , 367 .
Revised: April 17, 2015
Published online: June 5, 2015
A. Wylie , X. S. Xie , Nat. Chem. 2014 , 6 , 614 .
[16] M. V. Boland , R. F. Murphy , Bioinformatics 2001 , 17 , 1213 .
[17] a) S. Rin Jean , D. V. Tulumello , S. P. Wisnovsky , E. K. Lei ,
M. P. Pereira , S. O. Kelley , ACS Chem. Biol. 2014 , 9 , 323 ;
[1] a) N. V. Serbina , T. Jia , T. M. Hohl , E. G. Pamer , Annu. Rev. Immunol.
b) R. Mourtada , S. B. Fonseca , S. P. Wisnovsky , M. P. Pereira ,
2008 , 26 , 421 ; b) B. Mantovani , M. Rabinovitch , V. Nussenzweig ,
X. Wang , R. Hurren , J. Parfi tt , L. Larsen , R. A. Smith ,
J. Exp. Med. 1972 , 135 , 780 ; c) S. D. Ricardo , H. van Goor ,
M. P. Murphy , A. D. Schimmer , S. O. Kelley , PLoS One 2013 , 8 ,
A. A. Eddy , J. Clin. Invest. 2008 , 118 , 3522 ; d) P. J. Murray ,
T. A. Wynn , Nat. Rev. Immunol. 2011 , 11 , 723 .
[18] a) M. Vendrell , J. S. Lee , Y. T. Chang , Curr. Opin. Chem. Biol. 2010 ,
[2] a) M. L. Conalty , V. C. Barry , A. Jina , Int. J. Lepr. Other Mycobact. Dis.
14 , 383 .
1971 , 39 , 479 ; b) M. J. Reasor , Res. Commun. Chem. Pathol. Phar-
[19] a) Z.-B. Xu , Y. Lu , Z.-R. Guo , Synlett 2003 , 4 , 564 ; b) P. Kirsch ,
macol. 1991 , 72 , 169 ; c) M. S. Brown , J. L. Goldstein , Annu. Rev.
A. Schonleben-Janas , R. H. Schirmer , Liebigs Ann. 1995 , 1995 ,
Biochem. 1983 , 52 , 223 ; d) N. Anderson , J. Borlak , FEBS Lett. 2006 ,
580 , 5533 .
[20] a) J. F. O'Sullivan , M. L. Conalty , N. E. Morrison , J. Med. Chem. 1988 ,
[3] a) A. J. Atkinson Jr. , J. N. Sheagren , J. B. Rubio , V. Knight , Int.
31 , 567 ; b) J. F. O'Sullivan , J. Chem. Res. Miniprint 1984 , 29 , 52.
J. Lepr. Other Mycobact. Dis. 1967 , 35 , 119 ; b) WHO Model Lists of
[21] C. Hansch , A. Leo , Substituent Constants for Correlation Analysis in
Chemistry and Biology , Wiley , New York 1979 , pp. 18 .
essentialmedicines/en/, accessed: May 2015.
[22] a) R. W. Horobin , F. Rashid-Doubell , J. D. Pediani , G. Milligan , Bio-
[4] a) J. Baik , G. R. Rosania , PLoS One 2012 , 7 , e47494 ; b) J. Baik ,
tech. Histochem. 2013 , 88 , 440 ; b) R. W. Horobin , F. Rashid-Doubell ,
K. A. Stringer , G. Mane , G. R. Rosania , Antimicrob. Agents Chem-
Biotech. Histochem. 2013 , 88 , 461 .
other. 2013 , 57 , 1218 .
[23] B. S. DeMay , N. Noda , A. S. Gladfelter , R. Oldenbourg , Biophys.
[5] A. M. Kaufmann , J. P. Krise , J. Pharm. Sci. 2007 , 96 , 729 .
J. 2011 , 101 , 985 .
[6] R. W. Horobin , S. Trapp , V. Weissig , J. Controlled Release 2007 ,
[24] H. Abdi , L. J. Williams , Wiley Interdiscip. Rev.: Comput. Stat. 2010 ,
121 , 125 .
2 , 433 .
Adv. Sci. 2015, 2, 1500025
2015 The Authors. Published by WILEY-VCH Verlag GmbH & Co. KGaA, Weinheim
wileyonlinelibrary.com (11 of 11) 1500025
Source: http://rahulkeswani.weebly.com/uploads/2/3/6/0/23602636/[2015]_min_rosania_et_al_2015_massive_phenazine_bioaccumulation_adv_sci_2_8_1500025.pdf
2011 report on 2010 drug violations 2
DRUGS IN U.S. RACING - 2010 THE FACTS With more rigorous standards than the Olympics, professional horse racing has the most aggressive drug testing program in professional sports, testing for more substances with greater sensitivity than anyone else. September 1, 2011 Copyright: 2011. Association of Racing Commissioners International.
Tender for purchase of medicines & surgicals for dispensary of jail
DEPARTMENT CHANDIGARH TENDER DOCUMENT FOR PURCHASE OF FOR DISPENSARY MODEL JAIL, CHANDIGARH. Page 1 of 15 Chapter-1 Scope of Work: - Supply of medicines and surgical items for the dispensary of Model Jail, Chandigarh. The Jail Department, U.T., Chandigarh is having a Dispensary inside the Jail for providing treatment to the prisoners