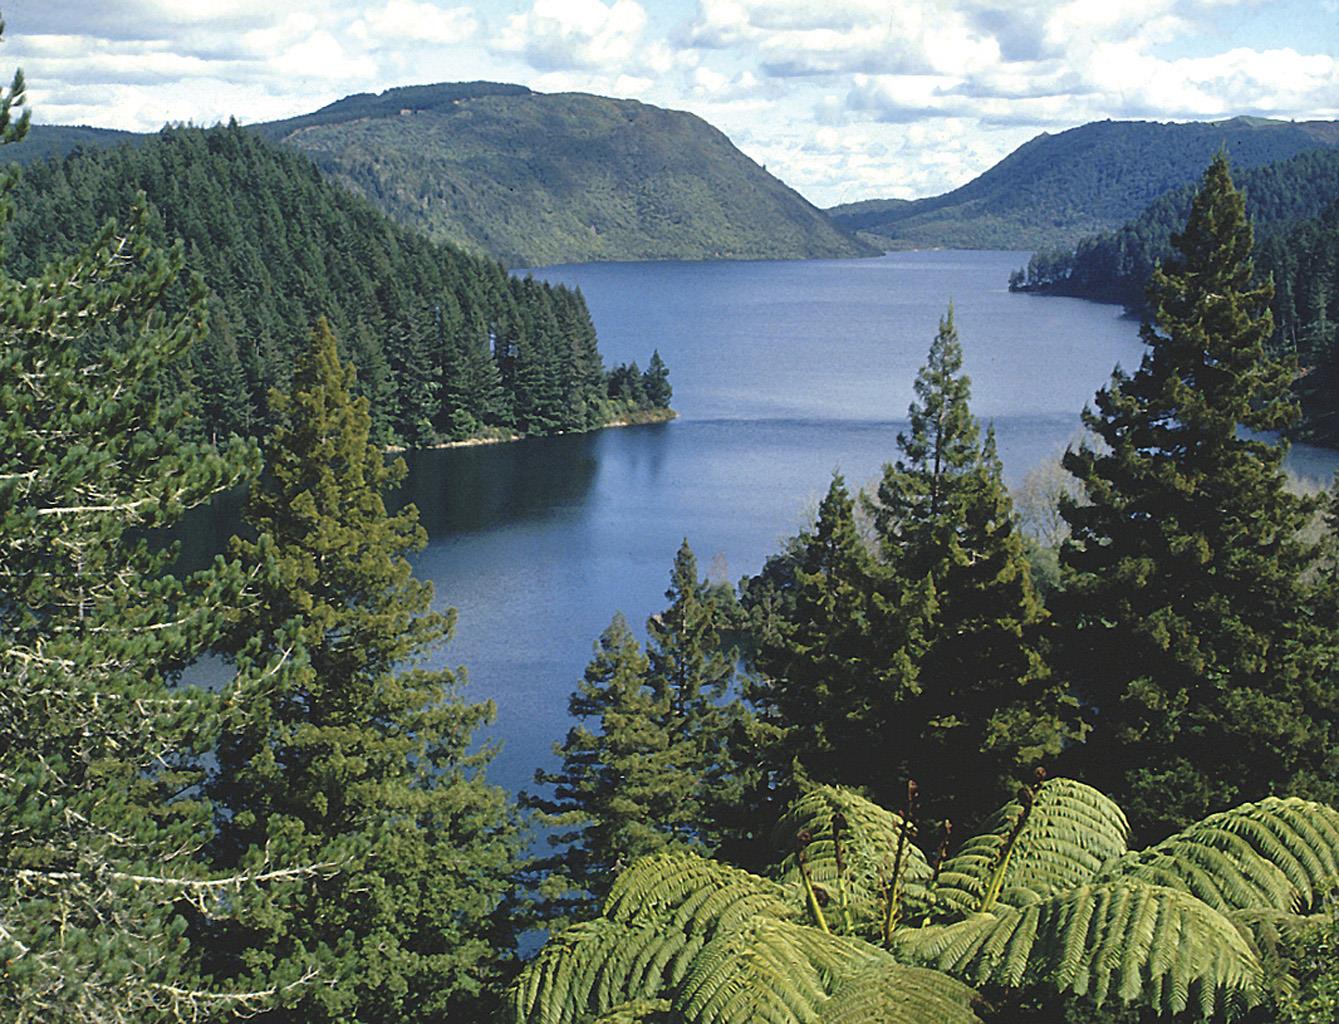
Report cover - forest environment


Nga Aho Rangahau o Maniapoto
Forest opportunities
Barbara Hock, Marie Heaphy, Duncan Harrison and Tim Payn
REPORT INFORMATION SHEET
REPORT TITLE
NGA AHO RANGAHAU O MANIAPOTO: FOREST OPPORTUNITIES
AUTHORS
BARBARA HOCK, MARIE HEAPHY, DUNCAN HARRISON, AND TIM
MANIAPOTO MĀORI TRUST BOARD
CLIENT CONTRACT
NO:
SIDNEY OUTPUT
NUMBER
SIGNED OFF BY
DATE
CONFIDENTIALITY
CONFIDENTIAL (FOR CLIENT USE ONLY)
INTELLECTUAL
NEW ZEALAND FOREST RESEARCH INSTITUTE LIMITED
ALL RIGHTS RESERVED. UNLESS PERMITTED BY CONTRACT OR LAW,
NO PART OF THIS WORK MAY BE REPRODUCED, STORED OR COPIED IN ANY FORM OR BY ANY MEANS WITHOUT THE EXPRESS PERMISSION
OF THE NEW ZEALAND FOREST RESEARCH INSTITUTE LIMITED (TRADING AS SCION).
Disclaimer
The information and opinions provided in the Report have been prepared for the Client and its specified
purposes. Accordingly, any person other than the Client uses the information and opinions in this report
entirely at its own risk. The Report has been provided in good faith and on the basis that reasonable
endeavours have been made to be accurate and not misleading and to exercise reasonable care, skill and
judgment in providing such information and opinions.
Neither Scion, nor any of its employees, officers, contractors, agents or other persons acting on its behalf or under its control accepts any responsibility or liability in respect of any information or opinions provided in this Report.
Table of Contents
Forest Opportunities
Barbara Hock, Marie Heaphy, Duncan Harrison and Tim Payn, Scion
SUMMARY
There are a range of forestry options for Maniapoto. Radiata pine grows well throughout the
rohe. On average, if the stand of trees is not too distant from an existing road, the returns
are good for forestry as no consideration needs to be included for land value and any
associated debt. Carbon forests are currently not a viable option as carbon prices are very
low, but even small annual payments can be useful cashflow when associated with a
traditional timber crop.
Alternate tree species provide niche opportunities for higher value, longer rotation trees
such as cypresses, totara, and kauri.
A number of understorey cropping opportunities are possible within the forest, including
manuka honey, kawa kawa which would grow well except in the southeast. Ginseng prefers
a cooler winter than the average regional temperatures indicate, however the predicted
weather is close to the desirable range so there is definite possibility for microsites meeting
the ideal conditions. Goldenseal requires continuous moisture for optimum growth which
could mean a requirement for irrigation or identification of wet valley bottom sites.
Riparian strips provide an opportunity for multi-storey plantings - as a linear arrangement of
the trees, the understorey plants are less shaded than in forest stands. This provides
shading for streams which in turn provides opportunities for freshwater kai. Higher value
longer rotation trees may be an option here for selective harvesting as riparian zones are
sensitive environmentally.
The economics for trees for wood and food, for example nut trees, are still under
development. Carbon credits for such trees are only possible if the primary purpose is for
wood / wood fibre, but not if the primary purpose is for nuts.
Introduction
A number of forest opportunities have been assessed across the rohe. The analysis used the
Forest Investment Finder (FIF), a spatial economic model for forestry (Harrison 2013).
For Radiata pine, all pasture and exotic scub are modelled into Pinus radiata structural (framing)
regime. The regime is an initial planting of 900 stems ha-1 (spha) thinned to 600 spha, with a
rotation length of 28 years.
Returns per hectare of Radiata pine, manuka planted for homey production, and kauri plantings
were assessed.
For non-wood forest products, ginseng, Goldenseal, and kawa kawa were modelled.
The potential for woody vegetation-based riparians was assessed.
The report concludes with a summary of the effects of climate change on forestry in the rohe.
Key assumptions
All data on costs and prices are an estimate at a generic/national level. These may not represent
site specific costs precisely.
A discount rate of 8% was used as it broadly represents the range of discount rates used currently
by forest growers for forest market valuations.
Prices for timber (Table 1) were based on an average price for each grade over 16 quarters (March
2008 – December 2011, inclusive) taken from MAF indicative domestic Radiata pine log prices
(MAF 2012).
Table 1: Regime, log grades and carbon price
Discount Rate
Timber $/tonne (*)
Carbon $/NZU
Structural (framing) regime
(initial planting of 900 spha
thinned to 600 spha)
(*) S1, S2 and S3 refer to different structural grades present along a stem
The carbon price per tonne of carbon dioxide sequestered was based on the forecast by CommTrade that indicates that the price will increase to $4 in May 2016 . The spot price for C as of 14 Jan 2014 stood at $3.40 per NZU.
For each regime the Net Present Value (NPV) of forestry in perpetuity was determined using discounted cash flow analysis. The economic analysis follows largely from that of Polglase et al (2008). The NPV represents the difference between costs and revenues, all related to the same time period; the present. Each cost and revenue surface was discounted to the present depending on the year for which the cash-flow occurred. The cash-flow analysis followed that of Boardman et al. (2001). Table 2 lists the type of data used in the development of forest scenarios.
Table 2: Data used to estimate the financial return
Costs (C)
Revenues (R)
Establishment (years 1,2,3)
Timber ($/tonne)
Silviculture (Thinning, year 7)
Access road construction ($/km)
Within-forest landings ($/m²)
Within-forest road construction ($/m²)
Harvesting ($/tonne)
Transport ($/tonne/km) (*)
ETS compliance ($/ha)
(*) Transport is estimated from the central point of each forest block to the nearest port and the nearest saw mill 1m³ of Pinus radiata timber = 1 tonne
Carbon: A standard annual compliance cost of $60/ha for the ETS was added to costs to cover
reporting and measurements (Turner et al 2008). To estimate the carbon revenue, we assumed
that the forest was managed to provide a non-declining yield (NDY) (Maclaren 2000) based on
volume control (Buongiorna and Gilles 2003).
The revenues from carbon are received as carbon credits expressed in New Zealand Units (NZUs). One NZU is equivalent to one tonne of carbon dioxide (CO2) sequestered (MPI 2011). The productivity surfaces for carbon calculate the total carbon sequestered in tonnes ha-1. This is then converted to CO2 equivalents using the mass ratio of carbon to CO2 (1:3.67) (USEPA 2005). The annual carbon revenue is then the non-declining yield times the price of carbon1.
1 Carbon is calculated using an annuity rather than actual estimates of carbon sequestered and emitted over time. The former was used for ease of evaluating the economics of carbon within the GIS, and that the two
Carbon revenue was calculated at $4/NZU. This represents modelling with carbon in the scenario.
To model without carbon in the scenario is achieved by setting $0/NZU.
Forest establishment costs
The cost of establishing a new plantation forest involves purchasing and planting the crop, and the
control of weeds to allow maximum tree growth during the crop establishment period. Some
assumptions were made in order to develop the cost estimates, these were;
Labour cost: $36 per hour (this is a labour cost not a wage rate, and includes transport, equipment,
consumables and contractor overhead)
Releasing operations base time: 3.5 man hours per hectare Planting operations base time: 8 man hours per hectare Tree stock: $400 per thousand seedlings Releasing chemical: $80 per hectare Mechanical preparation (cultivation or slash management): $20 per ha, applied to 7% of the total
area to be established.
An adjustment factor was developed to adjust costs based on slope steepness. From a modelling perspective we divided all catchments into four slope classes (Table 3).
Table 3: Slope adjustment factors for plantation forest establishment costs.
Description
Slope adjustment factor
5° - 15°
15° - 25°
> 25°
A hindrance adjustment factor was also developed for each establishment operation. This factor allows for extra time/cost when travel across a site becomes difficult because of obstacles such as vegetation and slash.
accounting approaches lead to similar, though not the same estimates of NPV of carbon credit revenues. The former provides a lower estimate NPV than the latter so it is more conservative.
The establishment costs per hectare for the first, second, and third years is given in Table 4 for a structural (framing) regime established at 900 stems per hectare. Establishment costs included:
Pre-plant spraying (assumes a manual spot operation, including labour and chemical) Planting (labour and tree-stocks) Two post-plant releasing operations (manual / spot including labour and chemical) The costs (labour, chemical and trees) for different regimes were adjusted for stockings
Table 4: Cost of plantation forest establishment for a structural (framing) regime established at 900 stems
Planting regime at 900 spha
Description
Year 1 ($ha-1)
Year 2 ($ha-1)
Year 3 ($ha-1)
Plantation forest thinning costs
A thinning regime was developed for a direct saw log regime with an initial stocking of 900 spha, and thinned to 600 spha at age 7. Labour costs for the thinning operations were assumed to be $45 per hour (including the costs of chainsaws, fuel, protective clothing, transport and overheads). Production rates and costs per hectare pruning and thinning were derived from relevant silvicultural time standards. Table 5 provides the costs of thinning classified by slope.
Table 5: Cost of thinning for a direct saw log regime with an initial stocking of 900 spha, and thinned to 600
Thinning costs
Direct sawlog regime
Description
Year 7 ($ha-1)
5° – 15°
15° – 25°
> 25°
Landing and road construction costs
Modelling the cost of landings and roads was undertaken using landing and road density estimates. Classification of landing density was estimated from maximum haul distance (MHD) associated with rubber-tyred ground-based (0°-10° slope), tracked ground-based (10°-20° slope), and hauler (>20° degree slope), with estimated maximum haul distances of 325 m, 350 m, and 370 m, respectively. Landing costs were then based on categories of soil order and groups. Landing density was used to calculate the number of landings required for each slope class area within each forest. For the estimation of internal road costs, a simplified version of impedance cost was developed from three slope classes, 0°-5°, 5°-15°, and >15° and four classes of erosion susceptibility (Bloomberg, et al., 2011). The Erosion Susceptibility Classification (ESC) relates soil erosion to forest resource management by assigning a low, moderate, high, or very high ESC class. Table 6 provides the estimated cost for the construction of internal road networks within a forest. Expert knowledge and published data [10,12] (Robinson 1990, LIRO Cable Logging Handbook) were used to estimate realistic densities and costs across the ESC and slope classes.
Table 6: Construction costs associated with the construction of internal roads within potential future forests.
Erosion Susceptibility Classification
Moderate
Very high
5° - 15°
>15°
Slope classes were also used to estimate the road density requirements within a forest. The
construction cost (Table 6) was then used to estimate the realistic cost of road construction within
forests on a per cell basis assigned across the slope and ESC classes.
Harvesting costs
Harvesting costs are base on slope classes with costs based on the Agrifax value (Table 7).
Harvesting cost was calculated using:
Cost of harvesting = Yield * Agrifax value
Table 7: Estimated logging cost ($ per tonne) by terrain/system and location
Extraction type
Agrifax value ($)
Flat Ground-based
Tracked Ground-based
>20°
Transport costs
The calculation of transport is from the central point of each forest block to the closest port or the
closest saw mill. The cost of transport is estimated at $0.22 per km.
The port used in the analysis New Plymouth, and the sawmill is R. H. Tregoweth Ltd at Te Kuiti
as they are the closest to the forests of the rohe.
In order to combine these per-kilometre costs with the other per-hectare costs, the total
transportation cost is calculated (km by volume by truck capacity), and then divided by the number
of hectares of forest being harvest. Transportation of logs can be a substantial cost, especially for
remote forests.
Radiata pine results
The area of pasture and exotic shrub in the rohe (Figure 1) sums to approximately 444,000
hectares, approximately half of which is in the higher, more impeded land capability classes LUC 5
and 6 (Figure 2, Table 8).
Table 8: Area per scenario
Land capability based on Land Use
Landcover based on LCDB4
Capability (LUC) in LRI
Scenario 1
High producing exotic grassland
Low producing exotic grassland
Gorse and/or broom
Mixed exotic shrubland
Scenario 2
High producing exotic grassland
Low producing exotic grassland
Gorse and/or broom
Mixed exotic shrubland
Figure 1. Assessing the viability of forestry based on a scenario of maximum afforestation
Figure 2. Lands with potential for forest plantings: currently covered in pasture or exotic shrub yet categorised as having some capability impedance
The plantation forest results, calculated based on the afforestation of all current pasture and exotic shrublands, are only indicative of the values for smaller plantings. The more remote a forests stand, the more the results will vary from this average. Two substantial contributors to harvesting costs are the kilometres of road construction required and the distance to port or mill – these could reduce the return significantly for forests far from roads and markets. Combining all costs and returns produces per-hectare profitability maps. Figure 3 shows the productivity map using a discount rate of 8%.
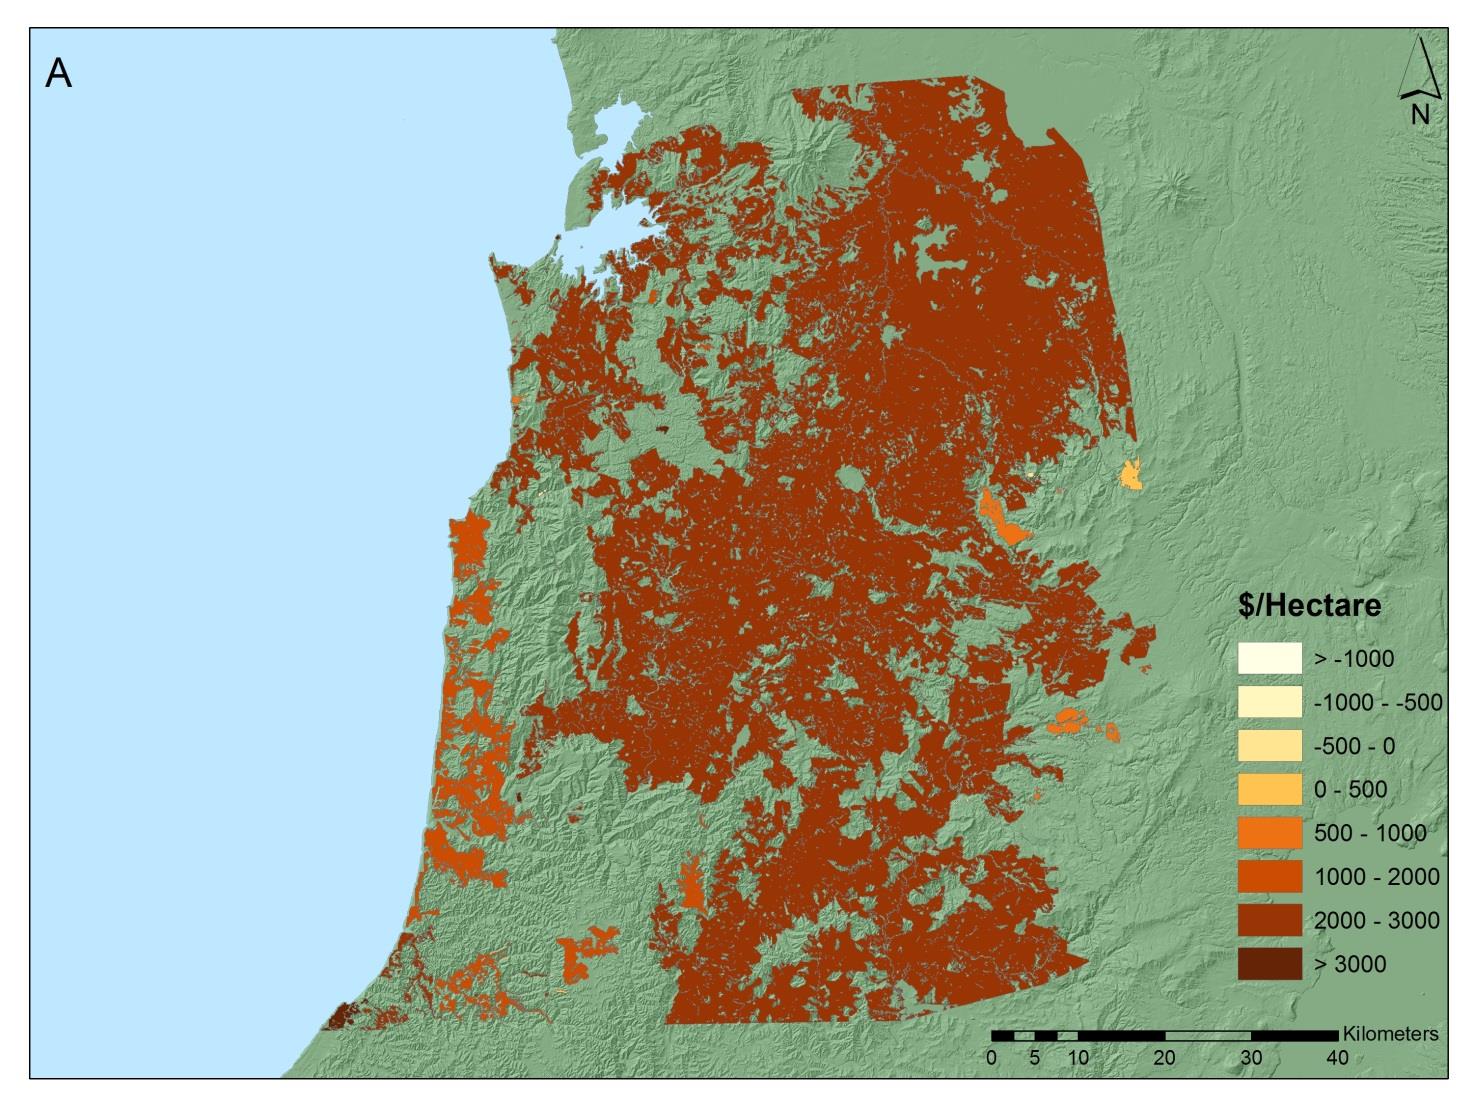
Figure 3. Expected returns from Radiata pine grown for structural timber based on a discount rate of 8% Radiata is, according to the scenario of Figure 3, profitable over the large majority of the rohe. However, in the absence of data for modelling specific blocks, this analysis underrepresents harvest costs such as road construction for remote blocks that ‘go it alone', i.e. are remote from existing roads and are not able to share construction costs across a larger plantation resource.
The discount rate of 4% is more commonly used when the cost of the land, as investment or opportunity cost, is not required to be factored into the costs. Table 9 shows the calculated returns based on a 4% discount rate.
Table 9 Economic analysis for Radiata pine
Activity
$ / hectare
Establishment
Thinning (year 7)
Landings
Harvest roading
Management
Admin, rates 1,070
0-10° Flat Ground-based $21/tonne 10-15° Tracked Ground-based $26/t
Harvesting
15-20° Steep Tracked $30/tonne 7,550 >20° Hauler $39/tonne
Transportation
0.22 $/tonne/km For example 5,220
Revenues
$/tonne S1 – $93 25,100 S2 – $85
S3 – $75 Pulp – $51
CO2 equiv. less admin; $4/NZU 575
Expected returns
Net Present Value (NPV)
Rotation 1 8,990
Rotation 2 9,555
Land Expectation Value (LEV)
*All values are discounted to the present from the year of implementation using: cost/(1+discount rate) year of implementation The NPV is the return expect from 1 rotation of forestry, where you minus all costs incurred from all revenue. The LEV is the NPV calculated into perpetuity. In our case taking the NPV from two rotations and discounting into the future using
The Land Expectation Value (LEV) is the net present value (NPV) of an investment in an even-aged stand from the time of planting, throughout infinite rotations of the same management regime (Faustmann, 1995). If the LEV is greater than the upfront cost of purchasing the land (i.e. the land value) then afforestation would be a rational investment from a private commercial perspective. Hence, if the land was already owned by the investor and the LEV was positive then forestry would be a viable option (Barry et al 2014). The opportunity cost is usually the cost of purchasing the land. In the Maniapoto case, however, the opportunity cost is the value of rent that is foregone by not renting the land to another party. A rental example is renting the land to a forestry company at $50/ha/yr to manage and harvest the trees.
Cypresses results
Where there is a preference for higher value, longer rotation trees, cypresses (Cupressus
lusitanica) is an option. Number of years per rotation was, for this scenario, set to 40 years. The
assumption was made that costs such as harvesting costs would be similar to those for Radiata
pine. Note that the LEV for other species such as eucalypts is similar to cypresses.
Table 10 shows the calculated returns based on a 4% discount rate.
Table 10 Economic analysis for cypresses
Activity
$ / hectare
Establishment
Thinning (year 7)
Landings
Harvest roading
Management
Admin, rates 1,070
0-10° Flat Ground-based $21/tonne 10-15° Tracked Ground-based $26/t
Harvesting
15-20° Steep Tracked $30/tonne 4,540 >20° Hauler $39/tonne
Transportation
0.22 $/tonne/km For example 3,820
Revenues
Expected returns
Net Present Value (NPV)
Rotation 1 19,460
Rotation 2 19,820
Land Expectation Value (LEV)
Manuka honey results
These indicative results are based manuka planted for honey production with income anticipated
annually from year 4. The assumption is for a productivity of 22 kilo/ha. The analysis shows
positive returns in all but a few places (Figure 4).
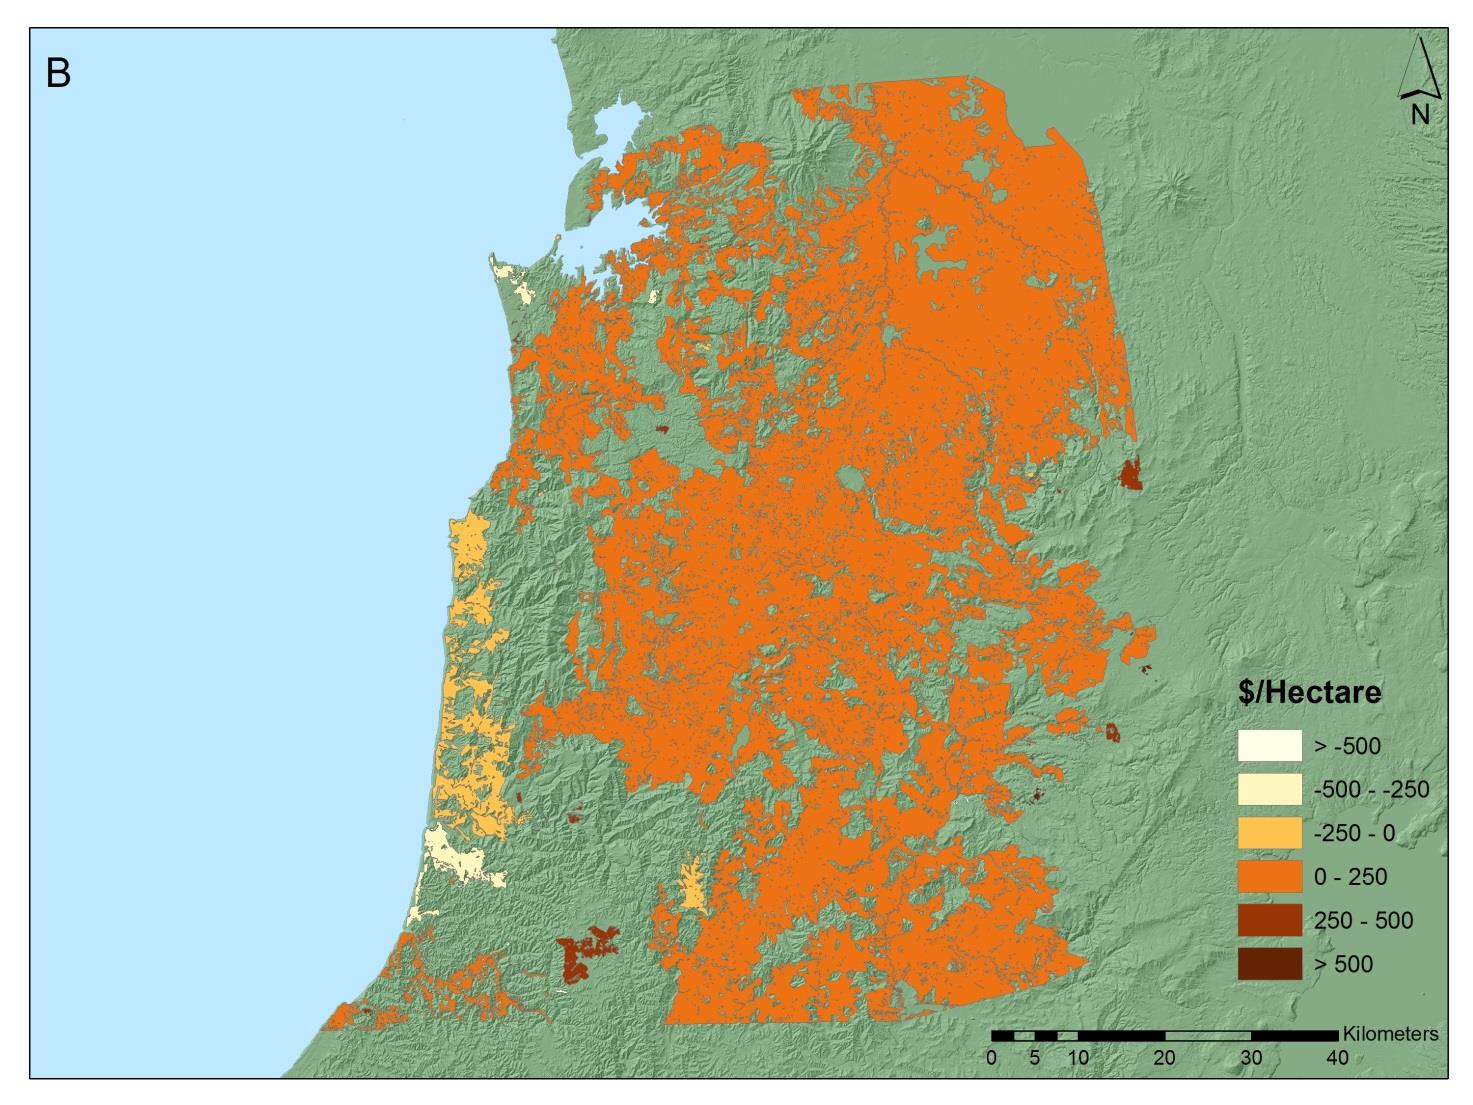
Figure 4. Expected returns from planting manuka for honey production
Table 11 shows the calculated returns based on a 4% discount rate.
Table 11 Economic analysis for manuka honey
Activity
$ / hectare
Establishment
Management
Admin, rates 1,070
Revenues
Expected returns
Net Present Value (NPV)
Land Expectation Value (LEV)
Kauri results
Planted kauri forestry is based on a 60-year rotation with a production thin at 40 years. Note that
the indicative results below assume that many costs such as harvesting and transportation are
equivalent to those of Radiata pine; this remains to be tested.
Kauri planted on the highest-yielding sites such as Northland have been analysed as having the
potential for offering a similar forestry investment case to Radiata pine (up to $1142/ha) (Heaphy et
al 2014). While there are only a few sites in the rohe that come near that order of magnitude, the
majority of the sites in this region show positive returns under current assumptions (Figure 5).
By including public benefits or ecosystem services (soil stabilisation, water quality and biodiversity)
in the analysis, a more positive dollar per hectare values results.
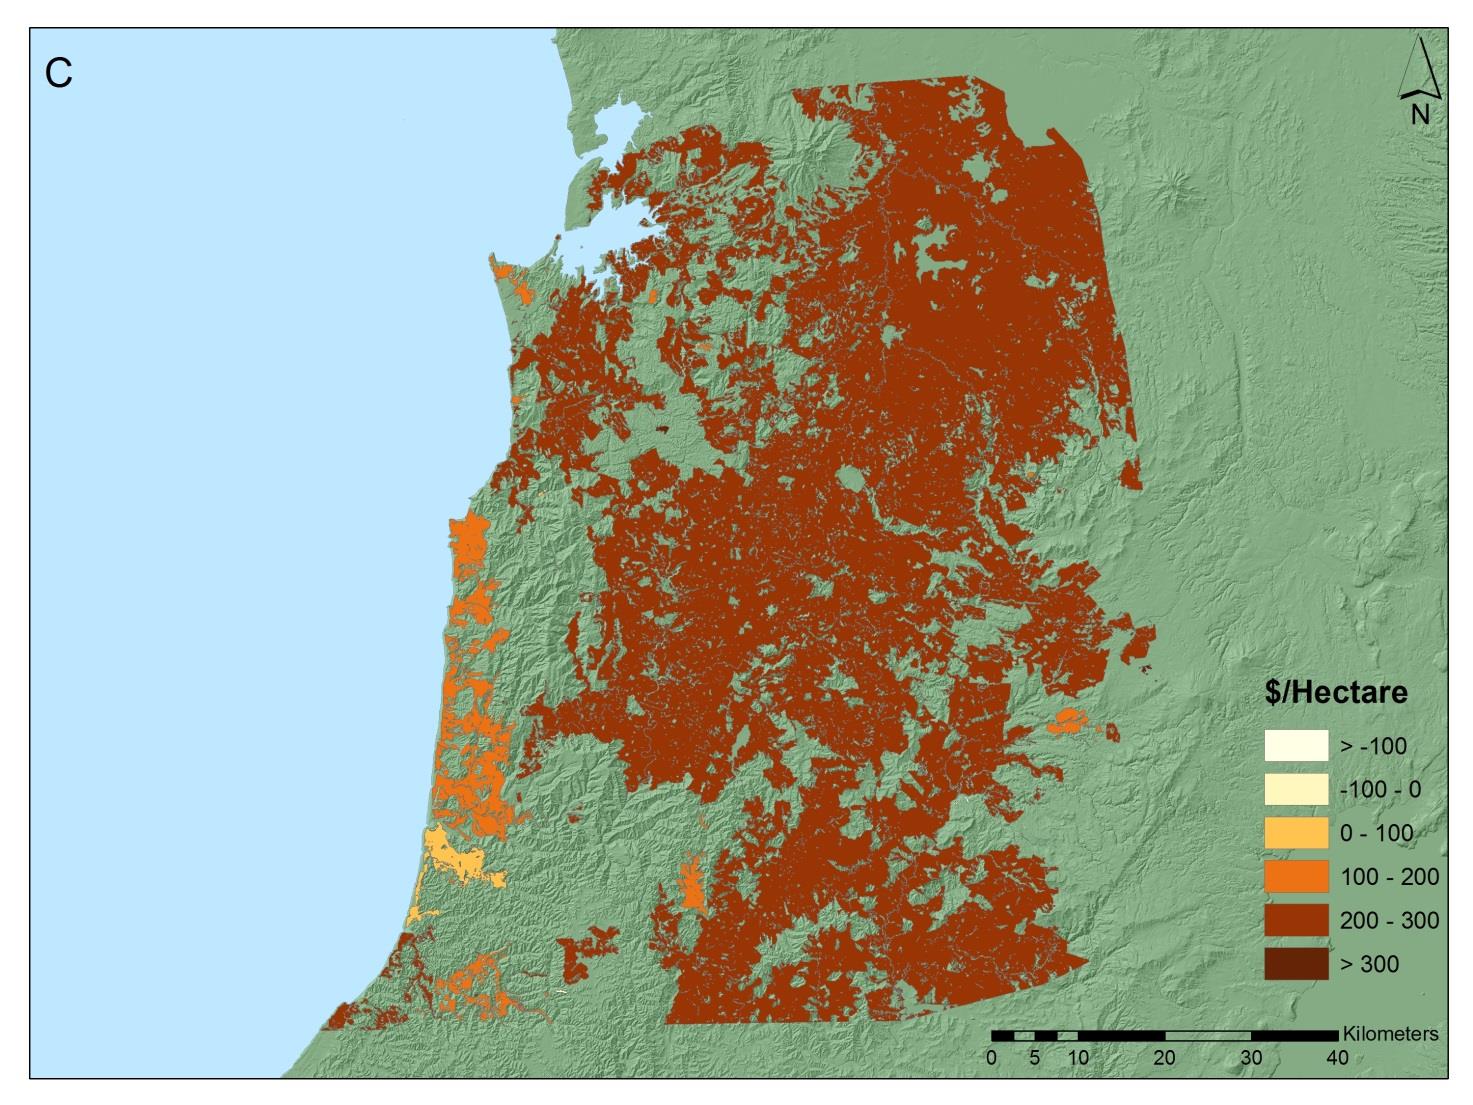
Figure 5. Expected returns from planted kauri (8% discount rate)
Table 12 shows the calculated returns based on a 4% discount rate.
Table 12 Economic analysis for kauri
Activity
$ / hectare
Establishment
Thinning (year 25)
Production thin(year 35)
Transportation 725
Harvest roading
Landings
Management
Admin, rates 1,570
0-10° Flat Ground-based $21/tonne 10-15° Tracked Ground-based $26/t
Harvesting
15-20° Steep Tracked $30/tonne 1,700 >20° Hauler $39/tonne
Transportation
0.22 $/tonne/km For example 810
Revenues
Production thin
Expected returns
Net Present Value (NPV)
Rotation 1 22,710
Rotation 2 23,350
Land Expectation Value (LEV)
Carbon for native species is unknown at this point, need to speak to Greg.
Non-wood forests products
Understorey crops show much potential for providing additional income during the approximate
twenty years from canopy closure (approximately age 7 for Radiata pine) until harvest (age 28-30
for Radiata pine). These include both indigenous and exotic understorey crops. Currently much of
the knowledge on species growth potential is based on their native environments; however,
increasing adoption is growing the New Zealand knowledge base, as well as market access
networks.
Ginseng
Ginseng is being grown for cultivation near Taupo ) and has been assessed as having a very high potential as a valuable understorey
crop. To successfully grow ginseng, a restrictive range of climate, topographical and soil variables
must be met. Soils should be moderately to well-drained and slightly acidic with planting taking
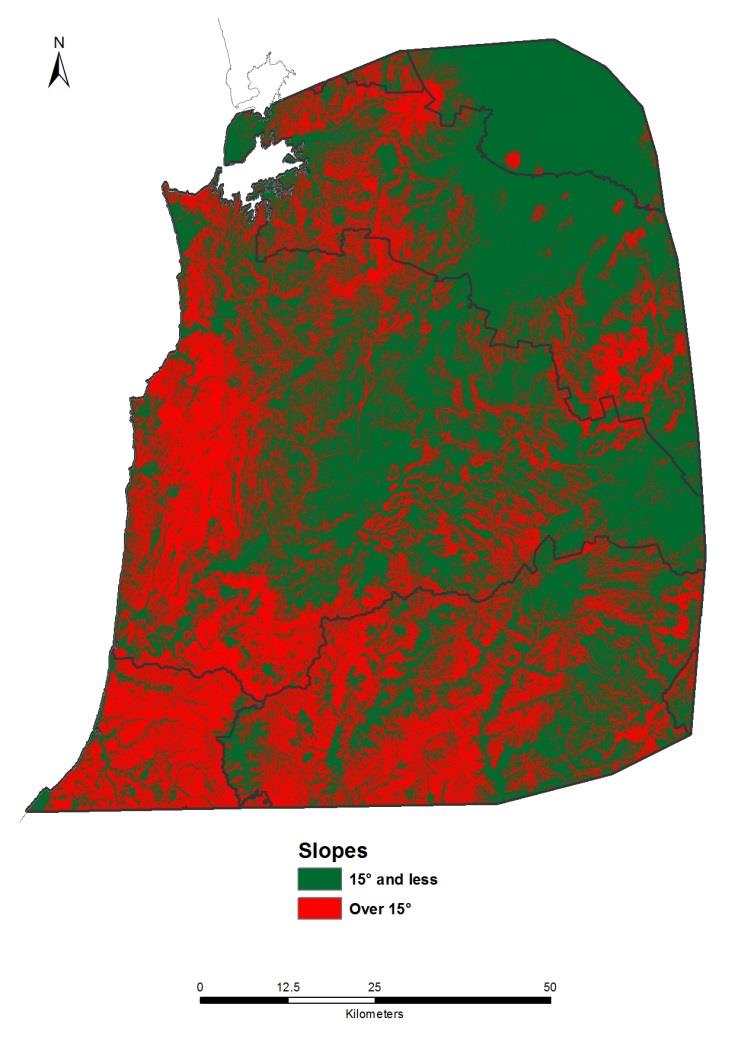
place on land that has slopes 15 or less. The Maniapoto rohe, contains 475,000 hectares of land
with a slope of 15° or less and 316,000 hectares with slope over 15° (Figure 6).
Figure 6. Assessment of slopes in the rohe for the potential to grow ginseng
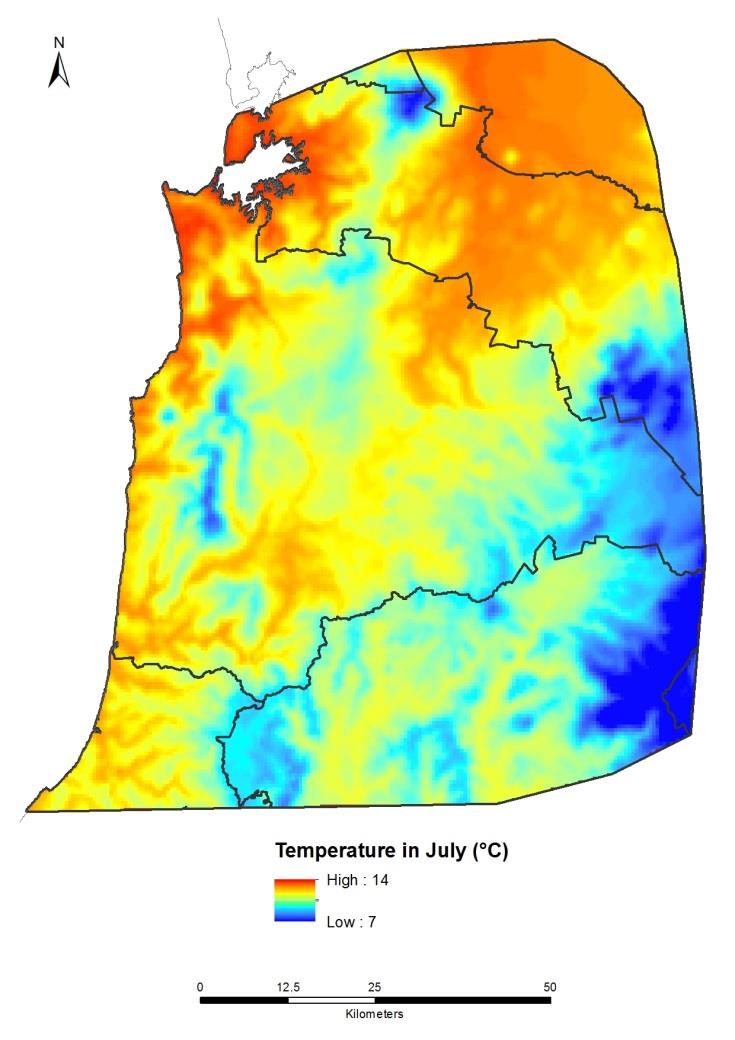
In addition, the maximum temperatures during June and July should not exceed 12°C as ginseng requires chilling during the dormant periods to enable buds and seeds to emerge from physiological dormancy the following spring (Konsler, 1986). Temperature data was extracted from climate rasters from the NIWA database containing the 30 year climate normal period 1981 – 2010 (NIWA, 2012) (Figure 7). For the Maniapoto rohe, the maximum temperatures during the month of June and July unfortunately do, on average, exceed the threshold, with the average maximum over 30 years reaching 14 and 15°C particularly for the flatter lands in the north. While this indicates that the rohe as a whole is not suitable for extensive ginseng growing, these temperatures are close to the desired range, creating the possibility that microsites exists that do meet the requirements. This would have to be assessed based on more detailed local knowledge.
Figure 7. Maximum monthly temperature in the rohe in July
Goldenseal
Goldenseal (Hydrastis canadensis) is a plant with supposed medicinal properties though this is yet
to be proven scientifically. It is native to the North Americas with a natural range extending to the
woodlands of southern Canada and to the eastern and southern regions of the United States
(USDA-NRCS 2007). USA and Canada are the two main producing and exporting countries of
goldenseal (Oldfield, 2005). In 2005, USA produced approximately 40.8 tonnes of dried goldenseal
roots valued at approximately NZ$3 million (AHPA 2007; Davis 2012).
Like ginseng, cultivation takes place on land with slopes of 15° or less. This species requires
continuous moisture as drought conditions lead to smaller root growth and early shoot senescence
(Follett and Douglas, 2013). One way to assess continuous moisture availability is to investigate
the average number of rain days per annum of a site (Figure 8) – the higher the number of rain
days, the more likely no drying out happens. The maximum number of rain days in Maniapoto
annually is around 170, which is considered insufficient for the continual wetting required to
support this crop. However, the installation of irrigation or the choice of a site that remains wet for
longer through factors such as soil type and drainage would resolve this issue.
Figure 8. Annual average rainfall days across the rohe
Kawakawa
Kawakawa (Macropiper excelsum) is found in the botanical family Piperaceae. It is endemic to
New Zealand and is found throughout the North Island and as far south as Okarito and Banks
Peninsula. It grows to a height of 6 m and is found in shady gullies or shaded rocky outcrops in
coastal regions. Berries are eaten by birds and the seed dispersed (Forest Flora, 2013). The
leaves and fruit can be used in cooking, medicine or cosmetics. Knowledge of the actions and uses
of this plant has been acquired through historical and current day use in Maori medicine. Volatile
oil constituents extracted from leaves, such as myristicin and elemicin have shown anti-
inflammatory action. Popular use includes treating dyspepsia, inflammation, pain relief, and use as
a circulation stimulant and detoxicant (NZAMH, 2013). Kawakawa poultices are applied to bruises
and skin abrasions to accelerate the healing process. The seeds can be used as a culinary spice
(Te Kete Ahumara, 2013).
Kawakawa requires damp shady conditions with freely draining soil. It needs to be sheltered from
frost; areas with a low likelihood of frost can be determined by climate data such as the number of
frost days in July (Figure 9). The climate data indicates that the rohe is well suited to growing
kawakawa except in the southeast.
Figure 9. Average frost days for July
Riparian forestry
Riparian strips can also be considered as a source of land for tree growing. As a linear
arrangement of the trees, the understorey plants are less shaded than in stands of trees providing
different opportunities. An example of Totara riparian strip is shown in Figure 10.
Figure 10. Totara riparians in Northland
The NZREC data (Snelder and Biggs 2002) overlaid with LCDB4 can be used to indicate where rivers flow through pasture (Figure 11). A riparian width of 10m on either side of the larger waterways sums to a total of over 8,000ha of riparian land across the whole rohe (Table 13). The reduction of pasture per paddock is relatively insignificant, while riparians provide protection for water quality. Utilising the riparian land for multiple purposes provides additional income from them.
Table 13: Riparian scenario
Riparian land cover (Based on LCDB4)
High producing exotic grassland
Low producing exotic grassland
Riparian buffers (10m) across pasture
Example area in Maniapoto rohe
Broadleaved Indigenous Hardwoods
High Producing Exotic Grassland
Indigenous Forest
Figure 11. Example of riparian area analysis
Climate change
Potential climate changes, as modelled by NIWA, can be used to estimate effects on plant
productivity. The key messages for forestry are (Clark et al 2012)
Forestry has a different impact profile and planning horizon to the other land-based sectors, given
its relatively slow biological response rate and long harvest cycle.
The most certain direct impact of climate change is increased yield of radiata pine in many
Under climate change, forestry also faces less predictable – but expected – increases in risk from
indirect impacts, from pests and diseases, fire risks and extreme storms, which may reduce productivity and compromise wood quality
Forest companies already manage those same risks over a long planning horizon through adaptive
risk management, but climate change is expected to exacerbate existing problems.
Foresters have a range of tactical management options – such as silviculture and site and species
selection – or interventions, like spraying and ongoing monitoring. Once production forests are established, options and opportunities for adaptation to site-specific impacts are reduced.
As the forest sector learns more about indirect impacts, strategic and transformational adaptation
becomes increasingly focussed on adjusting management to cope with them.
References
AHPA (2007) Tonnage Survey of Select North American Wild-Harvested Plants, 2004–2005.
American Herbal Products Association, Silver Spring, Maryland, USA.
Barry, L.E.; Yao, R.T.; Harrison, D.R.; Paragahawewab, U.H. and Pannell, D.J. (2014) Enhancing
ecosystem services through afforestation: How policy can help. Land Use Policy 39 (2014) 135–145
Boardman, A.E., Greenberg, D.H., Vining, A.R., and Weimer, D.L. (2006) Cost-Benefit analysis:
Concepts and practice. 3rd Edition ed. Upper Saddle River, New Jersey: Prentice Hall.
Buongiorno, J., and Gilles, J.K. (2003) Decision methods for forest resource management. San
Diego: Academic Press.
Clark, A.J.; Nottage, R.A.C.; Wilcocks, L.; Lee, J.M.; Burke, C.; Kalaugher, E.; Roche, J.; Beukes,
P.; Lieffering, M.; Newton, P.C.D.; Li, F.Y.; Vibart, R.; Teixeira, E.I.; Brown, H.E.; Fletcher, A.L.; Hernandez-Ramirez, G.; Soltani, A.; Viljanen-Rollinson, S.; Horrocks, A.; Johnstone, P.; Clothier, B.; Hall, A.; Green, S.; Dunningham, A.; Kirschbaum, M.U.F.; Meason, D.; Payn, T.; Collins, D.B.G.; Woods, R.A.; Rouse, H.; Duncan, M.; Snelder, T.; Cowie, B. (2012). Impacts of Climate Change on Land-based Sectors and Adaptation Options. Clark, A.J.; Nottage, R.A.C.; Hansford, D. (eds) Stakeholder Report to the Sustainable Land Management and Climate Change Adaptation Technical Working Group, Ministry for Primary Industries, 76 p.
Davis, J.M. and Dressler, A. (2012) Goldenseal (Hydrastis canadensis L.). Mountain Horticultural
Crops Research and Extension Center. North Carolina State University.
Follett, J and Douglas, J (2004) Goldenseal production in New Zealand forests, New Zealand Tree
Grower, November.
Forest Flora (2013) Native Plant Nursery Specialising in Recreating Forests and Wetlands,
accessed October 2013.
Heaphy, M J; Yao, R T; Lerouxdebretagne, F; Bradley, T (2013) Review of select understorey
crops for Tarawera Land Company. Sustainable Farming Fund: Maori Agribusiness Report.
Konsler, T. R. (1986). Effect of stratification temperature and time of rest fulfillment and growth in
American ginseng. J. Amer. Soc. Hort. Sci., 111(5), 651-654.
Maclaren, J.P. (2000) Trees in the greenhouse: The role of forestry in mitigating the enhanced
greenhouse effect. In Forest Research Bulletin. Scion: Rotorua, NZ.
MAF (2012) Indicative New Zealand Radiata pine log prices by quarter. Retrieved from
MPI (2011) A guide to forestry in the emissions trading scheme. Wellington: Ministry of Primary
National Institute of Water and Atmospheric Research (NIWA). (2012). National and regional
climate maps. Retrieved 22 May 2014 from
New Zealand Association of Medical Herbalists (2013) Kawakawa Monograph, accessed October
Polglase, P., Paul, K., Hawkins, C., Siggins, A., Turner, J.A., Booth, T., Crawford, D., Jovanovic,
T., Hobbs, T., Opie, K., Almeida, A., and Carter, J. (2008) Regional opportunities for agroforestry systems in Australia. Kingston, Australia: Rural Industries Research Development Corporation.
Te Kete Ahumara, (2013). The knowledge basket of growing food, accessed October 2013,
Turner, J.A., West, G., Dungey, H., Wakelin, S., MacLaren, P., Adams, T., and Silcock, P. (2008)
Managing New Zealand planted forests for carbon. A review of selected scenarios and identification of knowledge gaps. Report to the Ministry of Agriculture and Forestry 130pp.
USDA-NRCS 2007. Hydrastis canadensis L. Goldenseal. Accessed on 10 October 2013 at
USEPA (2005) Greenhouse gas mitigation potential in U.S. forestry and agriculture. Washinton
DC: United States Environmental Protection Agency. Retrieved from
Source: http://www.maniapoto.iwi.nz/wp-content/uploads/2016/04/Forest-Scenarios.pdf
Bromley dermatology guidelines final edition february 201
Bromley Clinical Commissioning February 2011 Bromley PBC Dermatology Introduction Welcome to the Bromley PBC Dermatology Project. We would like to intro-duce you to some easy to follow, evidence based and locally referenced care pathways that have been designed to help GPs deliver a first class ser-vice to their patients. These guidelines follow on from the development of similar locally produced guidance for Gynaecology, ENT and Musculoskeletal Services and as such follow a similar format. Dermatology was chosen as the attendance rates in Bromley from GP referrals to dermatology outpatient services are well above the national average and there is a wide range between practices. Conse-quently, a recent peer review pilot (January to June 2010) was completed which confirmed that peer review and discussion of differential diagnoses could lead to a reduction in inappropriate referrals and improve our confi-dence levels and diagnostic skills with regards to skin conditions. To make the most of these guidelines, please spend a few minutes looking through them to see what there is and how they work. Pages 4 & 5 summa-rise the key points in a dermatology history, include some useful dermatol-ogy terminology and a guide for 2 week wait referrals. Thereafter there is a common format of one page algorithm and one page notes. All the algo-rithms read from top to bottom (with the exception of leg ulcer management) with as few boxes as possible. You will also find key messages and re-sources, these will help you find the guidance on which these pathways are based, patient information and images to help you. Please remember that these are only guidelines which have been developed for use by GPs with the necessary knowledge to interpret them and, unless otherwise indicated, are to assist you in the management of adult patients. They may be controversial in places and, whilst we hope accurate at the time of going to print, recognise that service guidelines may change. Your clinical instinct must always come first. Please also note that practices with Scriptswitch will need to consider alternative products recommended at the point of prescribing e.g. emollients and antihistamines. If you have any cor-rections, questions or ideas for improvement please let us know by emailing [email protected] Thank you Drs Andrew Parson, Jon Doyle, Jackie Tavabie, Stephanie Munn, Sandy Flann, Chandima Sriwardhana, Geoffrey Barker, Abigail Barry & Janet Edmonds
rbccv.org
Braz J Cardiovasc Surg 2016;31(2):106-14 Clopidogrel use After Myocardial Revascularization: Prevalence, Predictors, and One-Year Survival Rate Paulo Roberto L. Prates1,2, MD; Judson B. Williams3,4, MD; Rajendra H. Mehta4,5, MD, MSc; Susanna R. Stevens5, MSc; Laine Thomas5, PhD; Peter K. Smith3, MD; L. Kristin Newby4,5, MD; Renato A. K. Kalil1,2, MD, PhD; John H. Alexander4,5, MD, MHS; Renato D. Lopes4,5, MD, PhD