Cukrovkanf.sk
e- and shape-dependent f ntaor l Materials
eign body immune response to
materials implanted in rodents and non-human primates
Size- and shape-dependent foreign body immune response to
materials implanted in rodents and non-human primates
Omid Veiseh*1,2,3, Joshua C. Doloff*1,3, Minglin Ma*1,3,4, Arturo J. Vegas1,3, Hok Hei Tam1,2, Andrew Bader1,3, Jie Li1,3, Erin Langan1,3, Jeffrey Wyckoff1, Whitney S. Loo2, Siddharth Jhunjhunwala1,3, Alan Chiu1,3, Sean Siebert1,3, Katherine Tang1,3, Jennifer Hollister-Lock5, Stephanie Aresta-Dasilva1,3, Matthew Bochenek6, Joshua Mendoza-Elias6, Yong Wang6, Merigeng Qi6, Danya M. Lavin1,3, Michael Chen1,3, Nimit Dholakia1,3, Raj Thakrar1,3, Igor Lacík7, Gordon C. Weir5, Jose Oberholzer6, Dale L. Greiner8, Robert Langer1,2,3,9,10,11, and Daniel G. Anderson1,2,3,9,10,11# 1. David H Koch Institute for Integrative Cancer Research, Massachusetts Institute of Technology, 500 Main Street, Cambridge, MA, 02139, USA 2. Department of Chemical Engineering, Massachusetts Institute of Technology, 77 Massachusetts Avenue, Cambridge, MA, 02139, USA 3. Department of Anesthesiology, Boston Children's Hospital, 300 Longwood Ave, Boston, MA 4. Current address: Biological and Environmental Engineering, Cornell University, Ithaca, NY 5. Section on Islet Cell and Regenerative Biology, Research Division, Joslin Diabetes Center, One Joslin Place, Boston, MA 02215, USA 6. Division of Transplantation, Department of Surgery, University of Illinois at Chicago, 7. Department for Biomaterials Research, Polymer Institute of the Slovak Academy of Sciences, Dubravska cesta 9, 845 41 Bratislava, Slovakia. 8. Program in Molecular Medicine, University of Massachusetts Medical School, Worcester, MA 9. Division of Health Science Technology, Massachusetts Institute of Technology, 77 Massachusetts Avenue, Cambridge, MA, 02139, USA 10. Institute for Medical Engineering and Science, Massachusetts Institute of Technology, 77 Massachusetts Avenue, Cambridge, MA, 02139, USA 11. Harvard-MIT Division of Health Science and Technology, Massachusetts Institute of Technology, 77 Massachusetts Avenue, Cambridge, MA, 02139, USA * Equal contributing authors #email: [email protected]; Tel.: +1 617 258 6843; fax: +1 617 258 8827. NATURE MATERIALS www.nature.com/naturematerials
2015 Macmillan Publishers Limited. All rights reserved Supplemental Index of Sections
Supplementary Figure S8 – Photographs of tissue punches and retrieved alginate spheres 1) Materials and Methods from the subcutaneous space of non-human primates (NHPs). a. Materials/Reagents Supplementary Figure S9 – Laparoscopic imaging during multiple minimally invasive b. Fabrication of alginate hydrogel spheres procedures (one implantation at day 0 and one retrieval at 2 weeks post-implant) for c. Polycaprolactone (PCL) sphere synthesis analysis of medium and large SLG20 spheres delivered into the intraperitoneal space of d. Rat Islet Isolation, Purification, and Encapsulation non-human (cynomolgus macaque) monkeys. e. Implantation/Transplantation surgeries Supplementary Figure S10 – Intracellular calcium influx in response to insulin f. Blood glucose monitoring g. Retrieval of cells, tissues, and materials Supplementary Figure S11 – Insulin secretion kinetics in response to insulin h. Imaging of the retrieved material spheres i. Newport Green and Live/Dead Islet Staining Supplementary Figure S12 – Individual BG correction plots comparing the efficacy of j. Confocal Immunofluorescence 0.5 mm and 1.5 mm alginate capsules encapsulating rat islets (500 IE's) in curing STZ- k. Histological processing for H&E and Masson's Trichrome staining induced C57BL/6 diabetic mice. l. Western Blotting Supplementary Figure S13 – Phase contrast images and FACS data from retrieved Ba- m. qPCR analysis crosslinked SLG20 microspheres of medium (0.5 mm) size 14 days post-intraperitoneal n. ELISpot multiplexed cytokine analysis implant into transgenic MAFIA-C57BL/6 mice (non-depleted vs macrophage depleted). o. Real-time fluorescence imaging of islet intracellular calcium Supplementary Figure S14 – Preparation of mice for intravital imaging. p. Insulin secretion kinetics Supplementary Figure S15 – Profiling macrophage phenotype shifts in the cells of the q. FACS analysis intraperitoneal space. r. Intravital Imaging and MAFIA depletion Supplementary Figure S16 – Profiling macrophage phenotype shifts in the cell of the s. NanoString analysis peripheral omentum fat tissue. t. Statistical analysis Supplementary Figure S17 – Cell dissociation protocol efficacy. 2) Supplementary Discussion-Diffusion of insulin and glucose 5. Supplement Video Legends 3) Supplementary Tables 6. Supplementary References Supplemental Table S1 – P-values for innate immune responses over time classified by macrophage markers, size, and days after implantation. Supplemental Table S2 – Mouse (m) or rat (r)-specific (host) forward and reverse primer 1. Materials and Methods
sets used for qPCR analysis of RNA levels. 4) Supplementary Figures a. Materials/Reagents Supplementary Figure S1 – Alginate hydrogel microspheres of 8 sizes where prepared All chemicals were obtained from Sigma-Aldrich (St. Louis, MO) and cell culture reagents with narrow size distributions. Supplementary Figure S2 – H&E (left) and Masson's trichrome (right) staining of SLG20 from Life Technologies (Grand Island, NY), unless otherwise noted. Antibodies: Alexa Fluor alginate hydrogel microspheres. 488-conjugated anti-mouse CD68 (Cat. #137012, Clone FA-11) and Alexa Fluor 647-conjugated Supplementary Figure S3 – Immunofluorescence confocal images of SLG20 alginate hydrogel microspheres of small (0.3 mm), medium (0.5 mm), and large (1 mm) sizes anti-mouse Ly-6G/Ly-6C (Gr-1) (Cat. #137012, Clone RB6-8C5) were purchased from retrieved after a 14-day implantation into the intraperitoneal space of C57BL/6 mice. BioLegend Inc. (San Diego, CA). Alexa Fluor 647-conjugated anti-mouse TGF beta1 (Cat. #bs- Supplementary Figure S4 – Phase contrast images from retrieved Ba-crosslinked SLG20 spheres of 0.5 mm, and 1.5 mm diameter spheres normalized by equivalent total surface 0103R-A647) was purchased from Bioss antibodies. Cy3-conjugated anti-mouse alpha smooth area implanted into the intraperitoneal space of C57BL/6 mice. muscle actin antibody was purchased from Sigma Aldrich (St. Louis MO). Filamentous actin (F- Supplementary Figure S5 – Phase contrast images from retrieved Ba-crosslinked SLG20 microspheres of small (0.3 mm), and large (1.5 mm) sizes 6 months post-intraperitoneal actin)-specific Alexa Fluor 488-conjugated Phalloidin, and Newport Green were purchased from implant into C57BL/6 mice. Life Technologies (Grand Island, NY). Glass spheres of medium (500 µm) and large size (2 mm) Supplementary Figure S6 – qPCR panels showing that the effect of increased size in preventing fibrosis holds true across different materials, even among different material where purchased from Sigma Aldrich (St. Louis, MO). Stainless steel spheres of medium (500µm) and large (2.5mm) size were purchased from Thomas Scientific (Swedesboro, NJ). Supplementary Figure S7 – Fibrosis deposition onto medium (0.5 mm) and large sized (2mm) glass microspheres implanted into the peritoneal cavity of Sprague-Dawley rats Polystyrene spheres of medium (400-500 µm) and large (2 mm) size where purchased from and retrieved after two 2 weeks. Phosphorex (Hopkinton, MA). A sampling of spheres used in study were submitted for 2015 Macmillan Publishers Limited. All rights reserved Supplemental Index of Sections
Supplementary Figure S8 – Photographs of tissue punches and retrieved alginate spheres 1) Materials and Methods from the subcutaneous space of non-human primates (NHPs). a. Materials/Reagents Supplementary Figure S9 – Laparoscopic imaging during multiple minimally invasive b. Fabrication of alginate hydrogel spheres procedures (one implantation at day 0 and one retrieval at 2 weeks post-implant) for c. Polycaprolactone (PCL) sphere synthesis analysis of medium and large SLG20 spheres delivered into the intraperitoneal space of d. Rat Islet Isolation, Purification, and Encapsulation non-human (cynomolgus macaque) monkeys. e. Implantation/Transplantation surgeries Supplementary Figure S10 – Intracellular calcium influx in response to insulin f. Blood glucose monitoring g. Retrieval of cells, tissues, and materials Supplementary Figure S11 – Insulin secretion kinetics in response to insulin h. Imaging of the retrieved material spheres i. Newport Green and Live/Dead Islet Staining Supplementary Figure S12 – Individual BG correction plots comparing the efficacy of j. Confocal Immunofluorescence 0.5 mm and 1.5 mm alginate capsules encapsulating rat islets (500 IE's) in curing STZ- k. Histological processing for H&E and Masson's Trichrome staining induced C57BL/6 diabetic mice. l. Western Blotting Supplementary Figure S13 – Phase contrast images and FACS data from retrieved Ba- m. qPCR analysis crosslinked SLG20 microspheres of medium (0.5 mm) size 14 days post-intraperitoneal n. ELISpot multiplexed cytokine analysis implant into transgenic MAFIA-C57BL/6 mice (non-depleted vs macrophage depleted). o. Real-time fluorescence imaging of islet intracellular calcium Supplementary Figure S14 – Preparation of mice for intravital imaging. p. Insulin secretion kinetics Supplementary Figure S15 – Profiling macrophage phenotype shifts in the cells of the q. FACS analysis intraperitoneal space. r. Intravital Imaging and MAFIA depletion Supplementary Figure S16 – Profiling macrophage phenotype shifts in the cell of the s. NanoString analysis peripheral omentum fat tissue. t. Statistical analysis Supplementary Figure S17 – Cell dissociation protocol efficacy. 2) Supplementary Discussion-Diffusion of insulin and glucose 5. Supplement Video Legends 3) Supplementary Tables 6. Supplementary References Supplemental Table S1 – P-values for innate immune responses over time classified by macrophage markers, size, and days after implantation. Supplemental Table S2 – Mouse (m) or rat (r)-specific (host) forward and reverse primer 1. Materials and Methods
sets used for qPCR analysis of RNA levels. 4) Supplementary Figures a. Materials/Reagents Supplementary Figure S1 – Alginate hydrogel microspheres of 8 sizes where prepared All chemicals were obtained from Sigma-Aldrich (St. Louis, MO) and cell culture reagents with narrow size distributions. Supplementary Figure S2 – H&E (left) and Masson's trichrome (right) staining of SLG20 from Life Technologies (Grand Island, NY), unless otherwise noted. Antibodies: Alexa Fluor alginate hydrogel microspheres. 488-conjugated anti-mouse CD68 (Cat. #137012, Clone FA-11) and Alexa Fluor 647-conjugated Supplementary Figure S3 – Immunofluorescence confocal images of SLG20 alginate hydrogel microspheres of small (0.3 mm), medium (0.5 mm), and large (1 mm) sizes anti-mouse Ly-6G/Ly-6C (Gr-1) (Cat. #137012, Clone RB6-8C5) were purchased from retrieved after a 14-day implantation into the intraperitoneal space of C57BL/6 mice. BioLegend Inc. (San Diego, CA). Alexa Fluor 647-conjugated anti-mouse TGF beta1 (Cat. #bs- Supplementary Figure S4 – Phase contrast images from retrieved Ba-crosslinked SLG20 spheres of 0.5 mm, and 1.5 mm diameter spheres normalized by equivalent total surface 0103R-A647) was purchased from Bioss antibodies. Cy3-conjugated anti-mouse alpha smooth area implanted into the intraperitoneal space of C57BL/6 mice. muscle actin antibody was purchased from Sigma Aldrich (St. Louis MO). Filamentous actin (F- Supplementary Figure S5 – Phase contrast images from retrieved Ba-crosslinked SLG20 microspheres of small (0.3 mm), and large (1.5 mm) sizes 6 months post-intraperitoneal actin)-specific Alexa Fluor 488-conjugated Phalloidin, and Newport Green were purchased from implant into C57BL/6 mice. Life Technologies (Grand Island, NY). Glass spheres of medium (500 µm) and large size (2 mm) Supplementary Figure S6 – qPCR panels showing that the effect of increased size in preventing fibrosis holds true across different materials, even among different material where purchased from Sigma Aldrich (St. Louis, MO). Stainless steel spheres of medium (500µm) and large (2.5mm) size were purchased from Thomas Scientific (Swedesboro, NJ). Supplementary Figure S7 – Fibrosis deposition onto medium (0.5 mm) and large sized (2mm) glass microspheres implanted into the peritoneal cavity of Sprague-Dawley rats Polystyrene spheres of medium (400-500 µm) and large (2 mm) size where purchased from and retrieved after two 2 weeks. Phosphorex (Hopkinton, MA). A sampling of spheres used in study were submitted for NATURE MATERIALS www.nature.com/naturematerials
2015 Macmillan Publishers Limited. All rights reserved endotoxin testing by a commercial vendor (Charles River, Wilmington, MA) and the results Polycaprolactone (PCL, Mn 70,000-90,000, Sigma) microspheres were prepared by solvent showed that spheres contained < 0.05 EU/ml of endotoxin levels. evaporation with medium (0.3-0.5 mm) and large (1.5-2.0 mm) diameters. Small diameter microspheres were fabricated by dissolving PCL in dichloromethane (Fisher) at 6.5% b. Fabrication of alginate hydrogel spheres concentration. This solution was introduced drop-wise into a 1% polyvinylalcohol (PVA, 88 Alginate hydrogel spheres were made using a custom-built, electro-jetting device, consisting mol% hydrolyzed, Polysciences Inc.) solution stirred using a stainless steel 4-blade overhead of a voltage generator, a vertical syringe pump, and a grounded autoclavable glass collector. The impeller at 200 rpm. After 75 min, the dispersion was added to 400 mL of ddH2O and stirred for voltage was coupled to the syringe and needle containing the alginate solution while the gelling an additional 105 min until all of the solvent evaporated. The microspheres were then sieved, bath was grounded to complete the circuit. Spheres were generated using a 1.4% solution of a washed several times with water, flash frozen in liquid nitrogen and lyophilized overnight. Large commercially available alginate (PRONOVA SLG20 (endotoxin levels or LF10/60 NovaMatrix, microspheres were prepared similarly using 9% polymer concentration, 0.5% PVA solution, and Sandvika, Norway) dissolved in 0.9% saline (pH ≈ 7.4, Osmotic pressure ≈ 290 mOsm), and a 3-blade overhead impeller stirred at 150 rpm. crosslinked using a BaCl2 gelling solution (20mM BaCl2, 250mM D-Mannitol, 25mM HEPES, pH ≈ 7.4, Osmotic pressure ≈ 290 mOsm)1. d. Rat Islet Isolation, Purification, and Encapsulation Alginate hydrogel microspheres of varying sizes were generated by utilizing different needle gauges, voltages, and flow rates; 0.3 mm spheres were generated using a 30G blunt needle, a Male Sprague-Dawley rats from Jackson Laboratories (Bar Harbor, ME) weighing voltage of 5kV, and a 200 µl/min flow rate, 0.4 mm spheres were generated with a 25G blunt approximately 300 grams were used for harvesting islets. All rats were anesthetized by a 1:20 needle, a voltage of 7kV and a 200 µl/min flow rate, 0.5 mm spheres were generated with a 25G xylazine (10 mg/kg) to ketamine (150 mg/kg) injection given intraperitoneally, and the total blunt needle, a voltage of 5kV and a 200 µl/min flow rate, 0.7 mm spheres were generated with a volume of each injection was 0.4 ml – 0.5 ml depending on the weight of rat. Isolation surgeries 25G blunt needle, a voltage of 4kV and a 180 µl/min flow rate, 0.9 mm spheres were generated were performed as described by Lacy and Kostianovsky2. Briefly, the bile duct was cannulated with an 18G blunt needle, a voltage of 7kV and a 200 µl/min flow rate, 1 mm spheres were and the pancreas was distended by an in vivo injection of 0.15% Liberase (Research Grade, generated with an 18G blunt needle, a voltage of 6kV and a 200 µl/min flow rate, 1.5 mm Roche) in RPMI 1640 media solution. Rats were sacrificed by cutting the descending aorta and spheres were generated with an 18G blunt needle, a voltage of 5kV and a 180 µl/min flow rate, the distended pancreatic organs were removed and held in 50 ml conical tubes on ice until the and 1.9 mm spheres were generated with an 18G blunt needle with a voltage of 5 kV and a 150 completion of all surgeries. All tubes were placed in a 37°C water bath for a 30 min digestion, µl/min flow rate. All microspheres were cross-linked in 250 mL of BaCl2-gelling solution in a which was stopped by adding 10-15 ml of cold M199 media with 10% heat-inactivated fetal sterile glass container. Immediately after crosslinking, the spheres were washed with HEPES bovine serum (HIFBS) and lightly shaking. Digested pancreases were washed twice in the same buffer (25mM HEPES, 1.2mM MgCl2×6H2O, 4.7mM KCl, 132mM NaCl2, pH≈7.4, ≈290 aforementioned M199 media, filtered through a 450 µm sieve, and then suspended in a mOsm) 4 times and stored overnight at 4°C. Immediately prior to implantation into the Histopaque 1077 (Sigma)/M199 media gradient and centrifuged at 1,700 RCF at 4°C. Depending peritoneal cavity of mice, the spheres were washed an additional 2 times with 0.9% saline. A on the thickness of the islet layer that was formed within the gradient, this step was repeated for sampling of the fabricated hydrogels was submitted for endotoxin testing by a commercial higher purity islets. Finally, the islets were collected from the gradient and further isolated by a vendor (Charles River, Wilmington, MA) and the results showed that LF10/60 spheres contained series of six gravity sedimentations, in which each supernatant was discarded after four minutes 31.6 EU/mL of endotoxins while SLG20 hydrogels contained < 0.05 EU/ml of endotoxin levels. of settling. Purified islets were hand-counted by aliquot under a light microscope and then washed three times in sterile 1X phosphate-buffered saline. Islets were then washed once in c. Polycaprolactone (PCL) sphere synthesis RPMI 1640 media with 10% HIFBS and 1% penicillin/streptomycin, and cultured in this media overnight for further use. 2015 Macmillan Publishers Limited. All rights reserved endotoxin testing by a commercial vendor (Charles River, Wilmington, MA) and the results Polycaprolactone (PCL, Mn 70,000-90,000, Sigma) microspheres were prepared by solvent showed that spheres contained < 0.05 EU/ml of endotoxin levels. evaporation with medium (0.3-0.5 mm) and large (1.5-2.0 mm) diameters. Small diameter microspheres were fabricated by dissolving PCL in dichloromethane (Fisher) at 6.5% b. Fabrication of alginate hydrogel spheres concentration. This solution was introduced drop-wise into a 1% polyvinylalcohol (PVA, 88 Alginate hydrogel spheres were made using a custom-built, electro-jetting device, consisting mol% hydrolyzed, Polysciences Inc.) solution stirred using a stainless steel 4-blade overhead of a voltage generator, a vertical syringe pump, and a grounded autoclavable glass collector. The impeller at 200 rpm. After 75 min, the dispersion was added to 400 mL of ddH2O and stirred for voltage was coupled to the syringe and needle containing the alginate solution while the gelling an additional 105 min until all of the solvent evaporated. The microspheres were then sieved, bath was grounded to complete the circuit. Spheres were generated using a 1.4% solution of a washed several times with water, flash frozen in liquid nitrogen and lyophilized overnight. Large commercially available alginate (PRONOVA SLG20 (endotoxin levels or LF10/60 NovaMatrix, microspheres were prepared similarly using 9% polymer concentration, 0.5% PVA solution, and Sandvika, Norway) dissolved in 0.9% saline (pH ≈ 7.4, Osmotic pressure ≈ 290 mOsm), and a 3-blade overhead impeller stirred at 150 rpm. crosslinked using a BaCl2 gelling solution (20mM BaCl2, 250mM D-Mannitol, 25mM HEPES, pH ≈ 7.4, Osmotic pressure ≈ 290 mOsm)1. d. Rat Islet Isolation, Purification, and Encapsulation Alginate hydrogel microspheres of varying sizes were generated by utilizing different needle gauges, voltages, and flow rates; 0.3 mm spheres were generated using a 30G blunt needle, a Male Sprague-Dawley rats from Jackson Laboratories (Bar Harbor, ME) weighing voltage of 5kV, and a 200 µl/min flow rate, 0.4 mm spheres were generated with a 25G blunt approximately 300 grams were used for harvesting islets. All rats were anesthetized by a 1:20 needle, a voltage of 7kV and a 200 µl/min flow rate, 0.5 mm spheres were generated with a 25G xylazine (10 mg/kg) to ketamine (150 mg/kg) injection given intraperitoneally, and the total blunt needle, a voltage of 5kV and a 200 µl/min flow rate, 0.7 mm spheres were generated with a volume of each injection was 0.4 ml – 0.5 ml depending on the weight of rat. Isolation surgeries 25G blunt needle, a voltage of 4kV and a 180 µl/min flow rate, 0.9 mm spheres were generated were performed as described by Lacy and Kostianovsky2. Briefly, the bile duct was cannulated with an 18G blunt needle, a voltage of 7kV and a 200 µl/min flow rate, 1 mm spheres were and the pancreas was distended by an in vivo injection of 0.15% Liberase (Research Grade, generated with an 18G blunt needle, a voltage of 6kV and a 200 µl/min flow rate, 1.5 mm Roche) in RPMI 1640 media solution. Rats were sacrificed by cutting the descending aorta and spheres were generated with an 18G blunt needle, a voltage of 5kV and a 180 µl/min flow rate, the distended pancreatic organs were removed and held in 50 ml conical tubes on ice until the and 1.9 mm spheres were generated with an 18G blunt needle with a voltage of 5 kV and a 150 completion of all surgeries. All tubes were placed in a 37°C water bath for a 30 min digestion, µl/min flow rate. All microspheres were cross-linked in 250 mL of BaCl2-gelling solution in a which was stopped by adding 10-15 ml of cold M199 media with 10% heat-inactivated fetal sterile glass container. Immediately after crosslinking, the spheres were washed with HEPES bovine serum (HIFBS) and lightly shaking. Digested pancreases were washed twice in the same buffer (25mM HEPES, 1.2mM MgCl2×6H2O, 4.7mM KCl, 132mM NaCl2, pH≈7.4, ≈290 aforementioned M199 media, filtered through a 450 µm sieve, and then suspended in a mOsm) 4 times and stored overnight at 4°C. Immediately prior to implantation into the Histopaque 1077 (Sigma)/M199 media gradient and centrifuged at 1,700 RCF at 4°C. Depending peritoneal cavity of mice, the spheres were washed an additional 2 times with 0.9% saline. A on the thickness of the islet layer that was formed within the gradient, this step was repeated for sampling of the fabricated hydrogels was submitted for endotoxin testing by a commercial higher purity islets. Finally, the islets were collected from the gradient and further isolated by a vendor (Charles River, Wilmington, MA) and the results showed that LF10/60 spheres contained series of six gravity sedimentations, in which each supernatant was discarded after four minutes 31.6 EU/mL of endotoxins while SLG20 hydrogels contained < 0.05 EU/ml of endotoxin levels. of settling. Purified islets were hand-counted by aliquot under a light microscope and then washed three times in sterile 1X phosphate-buffered saline. Islets were then washed once in c. Polycaprolactone (PCL) sphere synthesis RPMI 1640 media with 10% HIFBS and 1% penicillin/streptomycin, and cultured in this media overnight for further use. NATURE MATERIALS www.nature.com/naturematerials
2015 Macmillan Publishers Limited. All rights reserved Immediately prior to encapsulation, the cultured islets were centrifuged at 1,400 rpm for 1 needed for additional sedation. Animals were maintained on a circulating warm water blanket minute and washed with Ca-free Krebs-Henseleit (KH) Buffer (4.7mM KCl, 25mM HEPES, and covered with a towel during the procedure to maintain body temperature. Either 0.5 or 1.5 1.2mM KH2PO4, 1.2mM MgSO4×7H2O, 135mM NaCl, pH≈7.4, ≈290 mOsm). After washing, mm diameter SLG20 spheres were injected into the dorsal (back) regions of 4 non-human islets were centrifuged again and all supernatant was aspirated. The islet pellet was then re- primates (cynomolgus macaques) using 18 and 12 gauge custom-manufactured (Harvard suspended in a 1.4% solution of SLG20 alginate dissolved in 0.9% NaCl solution at an islet Apparatus) sterile stainless steel needles, with slip tip syringes in order to prevent shearing of our density of 1,000 islets per 0.75 ml alginate solution. Spheres were crosslinked using a BaCl2 biomaterial upon injection. Needles were inserted tangentially to the backs of the NHPs, and gelling solution and their sizes were controlled using similar procedures as the empty spheres were slid (tunneled) approximately 1-2 cm away from the initial injection point, in order to try to (described above). Immediately after crosslinking, the encapsulated islets were washed 4 times separate the injection from that of the site of eventual material response. Spheres (0.5 and 1.5 with HEPES buffer and 2 times with RPMI Medium 1640 with 10% HIFBS and cultured mm diameter) were injected into 4 total spots on the flank of 4 of our non-human primates: two overnight at 37°C for transplantation. As the islets had variable sizes (50 - 400 µm) and there spots on the left flank and two on the right, for 0.5 mm and 1.5 mm diameter sphere implants, was an inevitable loss of islets during the encapsulation process, the total number of respectively. Saline was injected and 4 mm diameter SLG20 alginate cylindrical discs were encapsulated islets were recounted and converted into islet equivalents (IE, normalized to 150 implanted by making a minimal 1 cm incision, also on the left and right sides of the back, µm size) based on a previously published method3 prior to transplantation. respectively into 3 additional primates. Incisions were closed with either a single interrupted suture with 3-0 nylon or VetBond (tissue glue). e. Implantation/Transplantation surgeries All animal protocols were approved by the MIT Committee on Animal Care, and all surgical f. Blood glucose monitoring procedures and post-operative care was supervised by MIT Division of Comparative Medicine To create insulin-dependent diabetic mice, healthy C57BL/6 mice were treated with veterinary staff. Immune-competent male non-diabetic or STZ-induced diabetic C57BL/6 mice Streptozotocin (STZ) by the vendor (Jackson Laboratory, Bar Harbor, ME) prior to shipment to (Jackson Laboratory, Bar Harbor, ME) or male Sprague-Dawley rats (Jackson Laboratory, Bar MIT. The blood glucose levels of all the mice were retested prior to transplantation. Only mice Harbor, ME) were anesthetized with 3% isoflurane in oxygen and had their abdomens shaved whose non-fasted blood glucose levels were above 300 mg/dL for two consecutive days were and sterilized using betadine and isopropanol. Preoperatively, all mice also received a 0.05 considered diabetic and underwent transplantation. mg/kg dose of buprenorphine subcutaneously as a pre-surgical analgesic, along with 0.3 mL of Blood glucose levels were monitored three times a week following transplantation of islet- 0.9% saline subcutaneously to prevent dehydration. A 0.5 mm incision was made along the containing alginate capsules. A small drop of blood was collected from the tail vein using a midline of the abdomen and the peritoneal lining was exposed using blunt dissection. The lancet and tested using a commercial glucometer (Clarity One, Clarity Diagnostic Test Group, peritoneal wall was then grasped with forceps and a 0.5-1 mm incision was made along the linea Boca Raton, FL). Mice with unfasted blood glucose levels below 200mg/dL were considered alba. A desired volume of spheres (all materials without islets, as well as SLG20 spheres normoglycemic. Monitoring continued until all mice had returned to a hyperglycemic state at encapsulating rat islets) were then loaded into a sterile pipette and implanted into the peritoneal which point they were euthanized and the spheres were retrieved. cavity through the incision. The incision was then closed using 5-0 taper-tipped polydioxanone (PDS II) absorbable sutures. The skin was then closed over the incision using a wound clip and g. Retrieval of cells, tissues, and materials At desired time points post-implantation or transplantation (with encapsulated islets), as For non-human primate (NHP) procedures, buprenorphine (0.01-0.03 mg/kg) was specified in figures, mice were euthanized by CO2 administration, followed by cervical administered as a pre-operative analgesic. NHPs were then sedated using an intramuscular (IM) dislocation. In certain instances, 5 ml of ice cold PBS was first injected in order perform an injection of ketamine (10 mg/kg) with an addition of midazolam as dictated by DCM vet staff if intraperitoneal lavage to rinse out and collect free-floating intraperitoneal immune cells. An 2015 Macmillan Publishers Limited. All rights reserved Immediately prior to encapsulation, the cultured islets were centrifuged at 1,400 rpm for 1 needed for additional sedation. Animals were maintained on a circulating warm water blanket minute and washed with Ca-free Krebs-Henseleit (KH) Buffer (4.7mM KCl, 25mM HEPES, and covered with a towel during the procedure to maintain body temperature. Either 0.5 or 1.5 1.2mM KH2PO4, 1.2mM MgSO4×7H2O, 135mM NaCl, pH≈7.4, ≈290 mOsm). After washing, mm diameter SLG20 spheres were injected into the dorsal (back) regions of 4 non-human islets were centrifuged again and all supernatant was aspirated. The islet pellet was then re- primates (cynomolgus macaques) using 18 and 12 gauge custom-manufactured (Harvard suspended in a 1.4% solution of SLG20 alginate dissolved in 0.9% NaCl solution at an islet Apparatus) sterile stainless steel needles, with slip tip syringes in order to prevent shearing of our density of 1,000 islets per 0.75 ml alginate solution. Spheres were crosslinked using a BaCl2 biomaterial upon injection. Needles were inserted tangentially to the backs of the NHPs, and gelling solution and their sizes were controlled using similar procedures as the empty spheres were slid (tunneled) approximately 1-2 cm away from the initial injection point, in order to try to (described above). Immediately after crosslinking, the encapsulated islets were washed 4 times separate the injection from that of the site of eventual material response. Spheres (0.5 and 1.5 with HEPES buffer and 2 times with RPMI Medium 1640 with 10% HIFBS and cultured mm diameter) were injected into 4 total spots on the flank of 4 of our non-human primates: two overnight at 37°C for transplantation. As the islets had variable sizes (50 - 400 µm) and there spots on the left flank and two on the right, for 0.5 mm and 1.5 mm diameter sphere implants, was an inevitable loss of islets during the encapsulation process, the total number of respectively. Saline was injected and 4 mm diameter SLG20 alginate cylindrical discs were encapsulated islets were recounted and converted into islet equivalents (IE, normalized to 150 implanted by making a minimal 1 cm incision, also on the left and right sides of the back, µm size) based on a previously published method3 prior to transplantation. respectively into 3 additional primates. Incisions were closed with either a single interrupted suture with 3-0 nylon or VetBond (tissue glue). e. Implantation/Transplantation surgeries All animal protocols were approved by the MIT Committee on Animal Care, and all surgical f. Blood glucose monitoring procedures and post-operative care was supervised by MIT Division of Comparative Medicine To create insulin-dependent diabetic mice, healthy C57BL/6 mice were treated with veterinary staff. Immune-competent male non-diabetic or STZ-induced diabetic C57BL/6 mice Streptozotocin (STZ) by the vendor (Jackson Laboratory, Bar Harbor, ME) prior to shipment to (Jackson Laboratory, Bar Harbor, ME) or male Sprague-Dawley rats (Jackson Laboratory, Bar MIT. The blood glucose levels of all the mice were retested prior to transplantation. Only mice Harbor, ME) were anesthetized with 3% isoflurane in oxygen and had their abdomens shaved whose non-fasted blood glucose levels were above 300 mg/dL for two consecutive days were and sterilized using betadine and isopropanol. Preoperatively, all mice also received a 0.05 considered diabetic and underwent transplantation. mg/kg dose of buprenorphine subcutaneously as a pre-surgical analgesic, along with 0.3 mL of Blood glucose levels were monitored three times a week following transplantation of islet- 0.9% saline subcutaneously to prevent dehydration. A 0.5 mm incision was made along the containing alginate capsules. A small drop of blood was collected from the tail vein using a midline of the abdomen and the peritoneal lining was exposed using blunt dissection. The lancet and tested using a commercial glucometer (Clarity One, Clarity Diagnostic Test Group, peritoneal wall was then grasped with forceps and a 0.5-1 mm incision was made along the linea Boca Raton, FL). Mice with unfasted blood glucose levels below 200mg/dL were considered alba. A desired volume of spheres (all materials without islets, as well as SLG20 spheres normoglycemic. Monitoring continued until all mice had returned to a hyperglycemic state at encapsulating rat islets) were then loaded into a sterile pipette and implanted into the peritoneal which point they were euthanized and the spheres were retrieved. cavity through the incision. The incision was then closed using 5-0 taper-tipped polydioxanone (PDS II) absorbable sutures. The skin was then closed over the incision using a wound clip and g. Retrieval of cells, tissues, and materials At desired time points post-implantation or transplantation (with encapsulated islets), as For non-human primate (NHP) procedures, buprenorphine (0.01-0.03 mg/kg) was specified in figures, mice were euthanized by CO2 administration, followed by cervical administered as a pre-operative analgesic. NHPs were then sedated using an intramuscular (IM) dislocation. In certain instances, 5 ml of ice cold PBS was first injected in order perform an injection of ketamine (10 mg/kg) with an addition of midazolam as dictated by DCM vet staff if intraperitoneal lavage to rinse out and collect free-floating intraperitoneal immune cells. An NATURE MATERIALS www.nature.com/naturematerials
2015 Macmillan Publishers Limited. All rights reserved incision was then made using the forceps and scissors along the abdomen skin and peritoneal Immunofluorescence imaging was used to determine immune populations attached to spheres. wall, and intraperitoneal lavage volumes were pipetted out into fresh 15 ml falcon tubes (each Materials were retrieved from mice and fixed overnight using 4% paraformaldehyde at 4°C. prepared with 5 ml of RPMI cell culture media). Next, a wash bottle tip was inserted into the Samples where then washed twice with KREBS buffer, permeabilized for 30 min using a 0.1% abdominal cavity. KREBS buffer was then used to wash out all material spheres from the Triton X100 solution, and subsequently blocked for 1 hour using a 1% bovine serum albumin abdomen and into petri dishes for collection. After ensuring all the spheres were washed out or (BSA) solution. Next, the spheres were incubated for 1 hour in an immunostaining cocktail manually retrieved (if fibrosed directly to intraperitoneal tissues), they were transferred into 50 solution consisting of DAPI (500 nM), specific marker probes (1:200 dilution) in BSA. After mL conical tubes for downstream processing and imaging. After intraperitoneal lavage and staining, spheres were washed three times with a 0.1% Tween 20 solution and maintained in a sphere retrieval, remaining fibrosed intraperitoneal tissues were also excised for downstream 50% glycerol solution. Spheres were then transferred to glass bottom dishes and imaged using an FACS and expression analyses. LSM 700 point scanning confocal microscope (Carl Zeiss Microscopy, Jena Germany) equipped For non-human primate subcutaneous retrievals, similar to when material was implanted, with 5 and 10X objectives. Obtained images where adjusted linearly for presentation using NHPs were once again given buprenorphine (0.01-0.03 mg/kg) as a pre-operative analgesic, and Photoshop (Adobe Inc. Seattle, WA). sedated using an IM injection of ketamine (10 mg/kg), with midazolam as dictated by DCM vet staff if needed for additional sedation. Animals were once again maintained on a circulating k. Histological processing for H&E and Masson's Trichrome staining warm water blanket and covered with a towel during the procedure to maintain body temperature. Retrieved materials where fixed overnight using 4% paraformaldehyde at 4°C. After fixation, 8 mm diameter biopsy punches were then used to sample the entire skin and subcutaneous space alginate sphere or retrieved tissue samples were washed using 70% alcohol. The materials where at 2 and later at 4 weeks post-implantation. Following biopsy punches, the retrieval site was then mixed with 4 degrees calcium-cooled Histogel (VWR, CA # 60872-486). After the molds closed with 3-0 nylon in a simple-interrupted pattern and VetBond (tissue glue). hardened, the blocks were processed for paraffin embedding, sectioning and staining according to standard histological methods. h. Imaging of the retrieved material spheres For phase contrast imaging retrieved materials were gently washed using Krebs buffer and l. Western Blotting transferred into 35 mm petri dishes for phase contrast microscopy using an Evos Xl microscope Protein was extracted directly from materials for western blot analysis. For protein analyses, (Advanced Microscopy Group). retrieved materials were prepared by immersing materials in Pierce RIPA buffer (Cat. #89901, For bright-field imaging of retrieved materials, samples were gently washed using Krebs Thermo Scientific) with protease inhibitors (Halt Protease inhibitor single-use cocktail, Cat. buffer and transferred into 35 mm petri dishes for bright-field imaging using a Leica #78430, Thermo Scientific) on ice, and then lysed by sonication (for 30 seconds on, 30 seconds Stereoscopic microscope. off, twice at 70% amplitude). Samples were then subjected to constant agitation for 2 hours at 4°C. Lysates were then centrifuged for 20 min at 12,000 rpm at 4°C, and protein-containing i. Newport Green and Live/Dead Islet Staining supernatants were collected in fresh tubes kept on ice. In samples from fat tissue, an excess of fat LIVE/DEAD® Viability/Cytotoxicity Kit (Life technologies, Carlsbad CA; CA# L-3224) was (a top layer on the supernatant) was first removed before supernatant transfer. 20 µg protein used according to the manufacturer's instructions to assess the viability of islets post- (quantified by BCA assay, Pierce BCA protein assay kit, Cat. #23225, Thermo Scientific) for encapsulation. Newport Green™ DCF Diacetate (Life technologies, Carlsbad CA; CA# N-7991), each lane was boiled at 95°C for 5 min and electrophoresed on SDS-polyacrylamide gels (Any cell permeant dye combined with DAPI was used to stain encapsulated islet cells post-retrieval. kD 15-well comb mini-gel, Biorad, Cat. #456-9036) and then blotted onto nitrocellulose membranes (Biorad, Cat. #162-0213). Blots were probed with anti-αSmooth Muscle actin j. Confocal Immunofluorescence 2015 Macmillan Publishers Limited. All rights reserved incision was then made using the forceps and scissors along the abdomen skin and peritoneal Immunofluorescence imaging was used to determine immune populations attached to spheres. wall, and intraperitoneal lavage volumes were pipetted out into fresh 15 ml falcon tubes (each Materials were retrieved from mice and fixed overnight using 4% paraformaldehyde at 4°C. prepared with 5 ml of RPMI cell culture media). Next, a wash bottle tip was inserted into the Samples where then washed twice with KREBS buffer, permeabilized for 30 min using a 0.1% abdominal cavity. KREBS buffer was then used to wash out all material spheres from the Triton X100 solution, and subsequently blocked for 1 hour using a 1% bovine serum albumin abdomen and into petri dishes for collection. After ensuring all the spheres were washed out or (BSA) solution. Next, the spheres were incubated for 1 hour in an immunostaining cocktail manually retrieved (if fibrosed directly to intraperitoneal tissues), they were transferred into 50 solution consisting of DAPI (500 nM), specific marker probes (1:200 dilution) in BSA. After mL conical tubes for downstream processing and imaging. After intraperitoneal lavage and staining, spheres were washed three times with a 0.1% Tween 20 solution and maintained in a sphere retrieval, remaining fibrosed intraperitoneal tissues were also excised for downstream 50% glycerol solution. Spheres were then transferred to glass bottom dishes and imaged using an FACS and expression analyses. LSM 700 point scanning confocal microscope (Carl Zeiss Microscopy, Jena Germany) equipped For non-human primate subcutaneous retrievals, similar to when material was implanted, with 5 and 10X objectives. Obtained images where adjusted linearly for presentation using NHPs were once again given buprenorphine (0.01-0.03 mg/kg) as a pre-operative analgesic, and Photoshop (Adobe Inc. Seattle, WA). sedated using an IM injection of ketamine (10 mg/kg), with midazolam as dictated by DCM vet staff if needed for additional sedation. Animals were once again maintained on a circulating k. Histological processing for H&E and Masson's Trichrome staining warm water blanket and covered with a towel during the procedure to maintain body temperature. Retrieved materials where fixed overnight using 4% paraformaldehyde at 4°C. After fixation, 8 mm diameter biopsy punches were then used to sample the entire skin and subcutaneous space alginate sphere or retrieved tissue samples were washed using 70% alcohol. The materials where at 2 and later at 4 weeks post-implantation. Following biopsy punches, the retrieval site was then mixed with 4 degrees calcium-cooled Histogel (VWR, CA # 60872-486). After the molds closed with 3-0 nylon in a simple-interrupted pattern and VetBond (tissue glue). hardened, the blocks were processed for paraffin embedding, sectioning and staining according to standard histological methods. h. Imaging of the retrieved material spheres For phase contrast imaging retrieved materials were gently washed using Krebs buffer and l. Western Blotting transferred into 35 mm petri dishes for phase contrast microscopy using an Evos Xl microscope Protein was extracted directly from materials for western blot analysis. For protein analyses, (Advanced Microscopy Group). retrieved materials were prepared by immersing materials in Pierce RIPA buffer (Cat. #89901, For bright-field imaging of retrieved materials, samples were gently washed using Krebs Thermo Scientific) with protease inhibitors (Halt Protease inhibitor single-use cocktail, Cat. buffer and transferred into 35 mm petri dishes for bright-field imaging using a Leica #78430, Thermo Scientific) on ice, and then lysed by sonication (for 30 seconds on, 30 seconds Stereoscopic microscope. off, twice at 70% amplitude). Samples were then subjected to constant agitation for 2 hours at 4°C. Lysates were then centrifuged for 20 min at 12,000 rpm at 4°C, and protein-containing i. Newport Green and Live/Dead Islet Staining supernatants were collected in fresh tubes kept on ice. In samples from fat tissue, an excess of fat LIVE/DEAD® Viability/Cytotoxicity Kit (Life technologies, Carlsbad CA; CA# L-3224) was (a top layer on the supernatant) was first removed before supernatant transfer. 20 µg protein used according to the manufacturer's instructions to assess the viability of islets post- (quantified by BCA assay, Pierce BCA protein assay kit, Cat. #23225, Thermo Scientific) for encapsulation. Newport Green™ DCF Diacetate (Life technologies, Carlsbad CA; CA# N-7991), each lane was boiled at 95°C for 5 min and electrophoresed on SDS-polyacrylamide gels (Any cell permeant dye combined with DAPI was used to stain encapsulated islet cells post-retrieval. kD 15-well comb mini-gel, Biorad, Cat. #456-9036) and then blotted onto nitrocellulose membranes (Biorad, Cat. #162-0213). Blots were probed with anti-αSmooth Muscle actin j. Confocal Immunofluorescence NATURE MATERIALS www.nature.com/naturematerials
2015 Macmillan Publishers Limited. All rights reserved antibody (1:400 dilution, Rabbit polyclonal to alpha smooth muscle actin; Cat. #ab5694, retrieval time points, RNA for all samples for each harvest condition (ie., ip lavage, spheres with AbCam), anti-PDX1 antibody (1:1000 dilution, Rabbit polyclonal to pancreatic & duodenal or without adhered cells and fibrosis, and peripheral tissues with infiltration, as described), were homeobox 1; Cat. #06-1379, EMD Millipore), and anti-β-actin antibody (1:4000 dilution, quantified, reverse transcribed, and analyzed by qPCR in parallel. Mouse-specific (host) or rat monoclonal anti-β-actin antibody produced in mouse; Cat. #A1978, Sigma Aldrich) as a loading (islet)-specific forward and reverse primer sets were utilized for this study (Supplemental Table control followed by donkey anti-rabbit (1:15,000 dilution, Cat. #926-32213, Li-Cor) and goat anti-mouse (1:15,000 dilution, Cat. #926-68070, Li-Cor) fluorophore-conjugated secondary antibodies. Antibody-antigen complexes were visualized using Odyssey detection (Li-Cor, n. ELISpot multiplexed cytokine analysis Serial No. ODY-2329) at 700 and 800 nm wavelengths. Cytokine array analysis was performed using the Proteome Profiler Mouse Cytokine Array Panel A kit (Cat. #ARY006, R&D Systems). For this analysis, proteins were extracted directly m. qPCR analysis from materials, as described above in the western blotting section. For each membrane, 200 µl Total RNA was isolated from tissue (peripheral tissue alone, spheres alone and/or with of protein solution was mixed with 100 µl of sample buffer (array buffer 4) and 1.2 ml of block adhered cells and fibrotic overgrowth, if present, and ip lavage alone), liquid nitrogen snap- buffer (array buffer 6), then added with 15 µl of reconstituted Mouse Cytokine Array Panel A frozen immediately following excision, using TRIzol (Invitrogen; Carlsbad, CA) according to Detection Antibody Cocktail and incubated at room temperature for 1 hour. The array membrane the manufacturer's instructions. In addition, to help ensure complete tissue disruption, we also was incubated with block buffer (array buffer 6) for 2 hours on a rocking platform shaker. The employed strong mechanical disruption with a Polytron homogenizer. Thus, gene expression block buffer was then aspirated, and the prepared sample/antibody mixture was added onto the signatures shown throughout are proportional and representative of the entire cell population membrane and incubated overnight at 4°C on a rocking platform shaker. The membrane was present on and/or around retrieved materials. Before reverse transcription using the High washed three times with 20 ml of 1X wash buffer for 10 minutes on a rocking platform shaker, Capacity cDNA Reverse Transcription kit (Cat. #4368814; Applied Biosystems, Foster City, rinsed once with deionized water, then probed with Fluorophore-conjugated streptavidin (1:5,000 CA), all samples were first normalized for comparison by loading the same input 1 µg total RNA dilution, Cat. #926-32230, Li-Cor) at room temperature for 30 minutes on a rocking platform in a volume of 20 µl for each sample. cDNA (4.8 µl; 1:20 dilution) in a total volume of 16 µl shaker, and then washed with wash buffer three more times and with deionized water once again, (including SYBR Green and PCR primers) was amplified by qPCR with the following primers. as described above. Antibody-antigen complexes were visualized using Odyssey Detection (Li- Primers (Table S2) were designed using Primer Express software (Applied Biosystems, Carlsbad, Cor, Serial No. ODY-2329) at a 800 nm wavelength. The densities of the spots were analyzed CA, USA) and evaluated using LaserGene software (DNAStar, Madison, WI, USA) to ensure using Image J software. either mouse or rat (host)-specificity. Samples were incubated at 95°C for 10 min followed by o. Real-time fluorescence imaging of islet intracellular calcium °C for 15 sec and 60°C for 1 min in an ABI PRISM 7900HT Sequence Detection System (Applied Biosystems). Results were analyzed using the comparative C Real-time fluorescence imaging of islet intracellular calcium [Ca2+]i was performed in a as described by the manufacturer. Results were analyzed using the comparative C microfluidic device modified for encapsulated islets4. In brief, fifty Sprague Dawley rat islets method and are presented as relative RNA levels compared to the RNA expression in either naked or encapsulated in alginate capsules (0.5 mm and 1.5 mm diameter) were incubated with 5 mock-implanted control cell samples (peripheral intraperitoneal fat tissue, or free floating µM Fura-2/AM (a calcium indicator, Molecular Probes, CA, USA) at 37°C in Krebs-Ringer intraperitoneal lavage cells) after normalization to the buffer (KRB) supplemented with 2 mM glucose (KRB2) and 0.5% BSA for 35 min. The islets β-actin RNA content of each sample. For were then loaded into the microfluidic device mounted on an inverted epifluorescence material spheres alone, we compared everything relative to either 0.3 or 0.5 mm alginate SLG20 microscope (Leica DMI 400B, IL, USA). Excess dye was washed out with KRB2 for 35 min at spheres. In addition, to further ensure proper normalization and sample handling across multiple 500 µL/min. Dual-wavelength Fura-2/AM dye were excited ratiometrically at 340 and 380 nm, 2015 Macmillan Publishers Limited. All rights reserved antibody (1:400 dilution, Rabbit polyclonal to alpha smooth muscle actin; Cat. #ab5694, retrieval time points, RNA for all samples for each harvest condition (ie., ip lavage, spheres with AbCam), anti-PDX1 antibody (1:1000 dilution, Rabbit polyclonal to pancreatic & duodenal or without adhered cells and fibrosis, and peripheral tissues with infiltration, as described), were homeobox 1; Cat. #06-1379, EMD Millipore), and anti-β-actin antibody (1:4000 dilution, quantified, reverse transcribed, and analyzed by qPCR in parallel. Mouse-specific (host) or rat monoclonal anti-β-actin antibody produced in mouse; Cat. #A1978, Sigma Aldrich) as a loading (islet)-specific forward and reverse primer sets were utilized for this study (Supplemental Table control followed by donkey anti-rabbit (1:15,000 dilution, Cat. #926-32213, Li-Cor) and goat anti-mouse (1:15,000 dilution, Cat. #926-68070, Li-Cor) fluorophore-conjugated secondary antibodies. Antibody-antigen complexes were visualized using Odyssey detection (Li-Cor, n. ELISpot multiplexed cytokine analysis Serial No. ODY-2329) at 700 and 800 nm wavelengths. Cytokine array analysis was performed using the Proteome Profiler Mouse Cytokine Array Panel A kit (Cat. #ARY006, R&D Systems). For this analysis, proteins were extracted directly m. qPCR analysis from materials, as described above in the western blotting section. For each membrane, 200 µl Total RNA was isolated from tissue (peripheral tissue alone, spheres alone and/or with of protein solution was mixed with 100 µl of sample buffer (array buffer 4) and 1.2 ml of block adhered cells and fibrotic overgrowth, if present, and ip lavage alone), liquid nitrogen snap- buffer (array buffer 6), then added with 15 µl of reconstituted Mouse Cytokine Array Panel A frozen immediately following excision, using TRIzol (Invitrogen; Carlsbad, CA) according to Detection Antibody Cocktail and incubated at room temperature for 1 hour. The array membrane the manufacturer's instructions. In addition, to help ensure complete tissue disruption, we also was incubated with block buffer (array buffer 6) for 2 hours on a rocking platform shaker. The employed strong mechanical disruption with a Polytron homogenizer. Thus, gene expression block buffer was then aspirated, and the prepared sample/antibody mixture was added onto the signatures shown throughout are proportional and representative of the entire cell population membrane and incubated overnight at 4°C on a rocking platform shaker. The membrane was present on and/or around retrieved materials. Before reverse transcription using the High washed three times with 20 ml of 1X wash buffer for 10 minutes on a rocking platform shaker, Capacity cDNA Reverse Transcription kit (Cat. #4368814; Applied Biosystems, Foster City, rinsed once with deionized water, then probed with Fluorophore-conjugated streptavidin (1:5,000 CA), all samples were first normalized for comparison by loading the same input 1 µg total RNA dilution, Cat. #926-32230, Li-Cor) at room temperature for 30 minutes on a rocking platform in a volume of 20 µl for each sample. cDNA (4.8 µl; 1:20 dilution) in a total volume of 16 µl shaker, and then washed with wash buffer three more times and with deionized water once again, (including SYBR Green and PCR primers) was amplified by qPCR with the following primers. as described above. Antibody-antigen complexes were visualized using Odyssey Detection (Li- Primers (Table S2) were designed using Primer Express software (Applied Biosystems, Carlsbad, Cor, Serial No. ODY-2329) at a 800 nm wavelength. The densities of the spots were analyzed CA, USA) and evaluated using LaserGene software (DNAStar, Madison, WI, USA) to ensure using Image J software. either mouse or rat (host)-specificity. Samples were incubated at 95°C for 10 min followed by o. Real-time fluorescence imaging of islet intracellular calcium °C for 15 sec and 60°C for 1 min in an ABI PRISM 7900HT Sequence Detection System (Applied Biosystems). Results were analyzed using the comparative C Real-time fluorescence imaging of islet intracellular calcium [Ca2+]i was performed in a as described by the manufacturer. Results were analyzed using the comparative C microfluidic device modified for encapsulated islets4. In brief, fifty Sprague Dawley rat islets method and are presented as relative RNA levels compared to the RNA expression in either naked or encapsulated in alginate capsules (0.5 mm and 1.5 mm diameter) were incubated with 5 mock-implanted control cell samples (peripheral intraperitoneal fat tissue, or free floating µM Fura-2/AM (a calcium indicator, Molecular Probes, CA, USA) at 37°C in Krebs-Ringer intraperitoneal lavage cells) after normalization to the buffer (KRB) supplemented with 2 mM glucose (KRB2) and 0.5% BSA for 35 min. The islets β-actin RNA content of each sample. For were then loaded into the microfluidic device mounted on an inverted epifluorescence material spheres alone, we compared everything relative to either 0.3 or 0.5 mm alginate SLG20 microscope (Leica DMI 400B, IL, USA). Excess dye was washed out with KRB2 for 35 min at spheres. In addition, to further ensure proper normalization and sample handling across multiple 500 µL/min. Dual-wavelength Fura-2/AM dye were excited ratiometrically at 340 and 380 nm, NATURE MATERIALS www.nature.com/naturematerials
2015 Macmillan Publishers Limited. All rights reserved and changes in the [Ca2+]i levels are expressed as F340/F380 (% increase from basal 2 mM (>90%) (See Supplemental Figure 17). All tissue and material sample-derived, single-cell
glucose). Excitation wavelengths were controlled by excitation filters (Chroma Technology, VT, populations were then subjected to red blood cell lysis with 5 ml of 1X RBC lysis buffer (Cat. USA) mounted in a Lambda DG-4 wavelength switcher. Emission of Fura-2/AM was filtered #00-4333, eBioscience, San Diego, CA, USA) for 5 min at 4oC. The reaction was terminated by using a Fura2/FITC polychroic beamsplitter and a double band emission filter (Chroma the addition of 20 ml of sterile 1X PBS. The cells remaining were centrifuged at 300-400g at Technology. Part number: 73.100bs). SimplePCI software (Hamamatsu Corp, IL, USA) was 4°C and resuspended in a minimal volume ( 50 µl) of eBioscience Staining Buffer (cat. #00- used for imaging acquisition and analysis. These images were collected with a high-speed, high- 4222) for antibody incubation. All samples were then co-stained in the dark for 25 min at 4°C resolution charge coupled camera (CCD, Retiga-SRV, Fast 1394, QImaging). with two of the fluorescently tagged monoclonal antibodies specific for the cell markers CD68 (1 Individual islet intracellular calcium responses were assessed with the following perifusion µl (0.5 µg) per sample; CD68-Alexa647, Clone FA-11, Cat. #11-5931, BioLegend), Ly-6G (Gr- protocol: 1) KRB2 (0-5 min); 2) 20 mM glucose (5-25 min); 3) KRB2 (25-45 min); 4) 30 mM 1) (1 µl (0.5 µg) per sample; Ly-6G-Alexa-647, Clone RB6-8C5, Cat. #108418, BioLegend), KCl (45-60 min); 5) KRB2 (60-70 min). The area under the curve for each time period was CD11b (1 µl (0.2 µg) per sample; or CD11b-Alexa-488, Clone M1/70, Cat. #101217, calculated for each individual islet in order to statistically compare groups using one-way BioLegend). Two ml of eBioscience Flow Cytometry Staining Buffer (cat. #00-4222, ANOVA (p < 0.05 as significant). Three separate batches of rodent isolations were used for eBioscience) was then added, and the samples were centrifuged at 400-500g for 5 min at 4°C. assessments where each condition was tested from the same batch of islets (naked islets n = 59; Supernatants were removed by aspiration, and this wash step was repeated two more times with staining buffer. Following the third wash, each sample was resuspended in 500 µl of Flow Cytometry Staining Buffer and run through a 40 µm filter (Cat. #22363547, Fisher Scientific) for p. Insulin secretion kinetics eventual FACS analysis using a BD FACSCalibur (cat. #342975), BD Biosciences, San Jose, CA, Islet insulin responses were assessed by loading 50 rat islets naked or encapsulated at 0.5 mm USA). For proper background and laser intensity settings, unstained, single antibody, and IgG and 1.5 mm alginate capsules into the same microfluidic device used for calcium measurements. (labled with either Alexa-488 or Alexa-647, BioLegend) controls were also run. Perifusate samples were collected every minute (500 µL/min) by an automated fraction collector (Gilson, model 203B, WI, USA). Insulin concentrations were quantified every other minute r. Intravital Imaging and MAFIA depletion using a rodent chemiluminescent insulin ELISA (Alpco, NH, USA). The following perifusion For intravital imaging, SLG20 hydrogels of 0.5 mm and 1.5 mm sizes were loaded with Qdot protocol was used: 1) KRB2 (0-20 min); 2) 20 mM glucose or 30 mM KCl (20-55 min); 3) 605 (Life technologies, Grand Island, NY) and surgically implanted into C57BL/6-Tg(Csf1r- KRB2 (55-100 min). The area under the curve for each insulin curve (n=3 for naked, 0.5 mm, EGFP-NGFR/FKBP1A/TNFRSF6)2Bck/J mice as described above. After 1, 4, or 7 days post and 1.5 mm) was calculated in order to statistically compare groups using one-way ANOVA (p < implantation, the mice were placed under isoflurane anesthesia and a small incision was made at 0.05 as significant). the site of the original surgery to expose beads. The mice were placed on an inverted microscope and imaged using a 25x, N.A. 1.05 objective on an Olympus FVB-1000 MP multiphoton q. FACS analysis microscope at an excitation wavelength of 860 nm. Z-stacks of 200 µm (10 µm steps) were Single-cell suspensions of freshly excised tissues were prepared using a gentleMACS acquired at 2-minute intervals for time series of 20 - 45 minutes depending on the image. The Dissociator (Miltenyi Biotec, Auburn, CA) according to the manufacturer's protocol. Single-cell mice were kept under constant isoflurane anesthesia and monitored throughout the imaging suspensions were prepared in a passive PEB dissociation buffer (1X PBS, pH 7.2, 0.5% BSA, session. Obtained images were analyzed using Velocity 3D Image Analysis Software (Perkin and 2 mM EDTA) and suspensions were passed through 70 µm filters (Cat. #22363548, Fisher Elmer, Waltham, MA). Scientific, Pittsburgh, PA). This process removed the majority of cells adhered to the surface 2015 Macmillan Publishers Limited. All rights reserved and changes in the [Ca2+]i levels are expressed as F340/F380 (% increase from basal 2 mM (>90%) (See Supplemental Figure 17). All tissue and material sample-derived, single-cell
glucose). Excitation wavelengths were controlled by excitation filters (Chroma Technology, VT, populations were then subjected to red blood cell lysis with 5 ml of 1X RBC lysis buffer (Cat. USA) mounted in a Lambda DG-4 wavelength switcher. Emission of Fura-2/AM was filtered #00-4333, eBioscience, San Diego, CA, USA) for 5 min at 4oC. The reaction was terminated by using a Fura2/FITC polychroic beamsplitter and a double band emission filter (Chroma the addition of 20 ml of sterile 1X PBS. The cells remaining were centrifuged at 300-400g at Technology. Part number: 73.100bs). SimplePCI software (Hamamatsu Corp, IL, USA) was 4°C and resuspended in a minimal volume ( 50 µl) of eBioscience Staining Buffer (cat. #00- used for imaging acquisition and analysis. These images were collected with a high-speed, high- 4222) for antibody incubation. All samples were then co-stained in the dark for 25 min at 4°C resolution charge coupled camera (CCD, Retiga-SRV, Fast 1394, QImaging). with two of the fluorescently tagged monoclonal antibodies specific for the cell markers CD68 (1 Individual islet intracellular calcium responses were assessed with the following perifusion µl (0.5 µg) per sample; CD68-Alexa647, Clone FA-11, Cat. #11-5931, BioLegend), Ly-6G (Gr- protocol: 1) KRB2 (0-5 min); 2) 20 mM glucose (5-25 min); 3) KRB2 (25-45 min); 4) 30 mM 1) (1 µl (0.5 µg) per sample; Ly-6G-Alexa-647, Clone RB6-8C5, Cat. #108418, BioLegend), KCl (45-60 min); 5) KRB2 (60-70 min). The area under the curve for each time period was CD11b (1 µl (0.2 µg) per sample; or CD11b-Alexa-488, Clone M1/70, Cat. #101217, calculated for each individual islet in order to statistically compare groups using one-way BioLegend). Two ml of eBioscience Flow Cytometry Staining Buffer (cat. #00-4222, ANOVA (p < 0.05 as significant). Three separate batches of rodent isolations were used for eBioscience) was then added, and the samples were centrifuged at 400-500g for 5 min at 4°C. assessments where each condition was tested from the same batch of islets (naked islets n = 59; Supernatants were removed by aspiration, and this wash step was repeated two more times with staining buffer. Following the third wash, each sample was resuspended in 500 µl of Flow Cytometry Staining Buffer and run through a 40 µm filter (Cat. #22363547, Fisher Scientific) for p. Insulin secretion kinetics eventual FACS analysis using a BD FACSCalibur (cat. #342975), BD Biosciences, San Jose, CA, Islet insulin responses were assessed by loading 50 rat islets naked or encapsulated at 0.5 mm USA). For proper background and laser intensity settings, unstained, single antibody, and IgG and 1.5 mm alginate capsules into the same microfluidic device used for calcium measurements. (labled with either Alexa-488 or Alexa-647, BioLegend) controls were also run. Perifusate samples were collected every minute (500 µL/min) by an automated fraction collector (Gilson, model 203B, WI, USA). Insulin concentrations were quantified every other minute r. Intravital Imaging and MAFIA depletion using a rodent chemiluminescent insulin ELISA (Alpco, NH, USA). The following perifusion For intravital imaging, SLG20 hydrogels of 0.5 mm and 1.5 mm sizes were loaded with Qdot protocol was used: 1) KRB2 (0-20 min); 2) 20 mM glucose or 30 mM KCl (20-55 min); 3) 605 (Life technologies, Grand Island, NY) and surgically implanted into C57BL/6-Tg(Csf1r- KRB2 (55-100 min). The area under the curve for each insulin curve (n=3 for naked, 0.5 mm, EGFP-NGFR/FKBP1A/TNFRSF6)2Bck/J mice as described above. After 1, 4, or 7 days post and 1.5 mm) was calculated in order to statistically compare groups using one-way ANOVA (p < implantation, the mice were placed under isoflurane anesthesia and a small incision was made at 0.05 as significant). the site of the original surgery to expose beads. The mice were placed on an inverted microscope and imaged using a 25x, N.A. 1.05 objective on an Olympus FVB-1000 MP multiphoton q. FACS analysis microscope at an excitation wavelength of 860 nm. Z-stacks of 200 µm (10 µm steps) were Single-cell suspensions of freshly excised tissues were prepared using a gentleMACS acquired at 2-minute intervals for time series of 20 - 45 minutes depending on the image. The Dissociator (Miltenyi Biotec, Auburn, CA) according to the manufacturer's protocol. Single-cell mice were kept under constant isoflurane anesthesia and monitored throughout the imaging suspensions were prepared in a passive PEB dissociation buffer (1X PBS, pH 7.2, 0.5% BSA, session. Obtained images were analyzed using Velocity 3D Image Analysis Software (Perkin and 2 mM EDTA) and suspensions were passed through 70 µm filters (Cat. #22363548, Fisher Elmer, Waltham, MA). Scientific, Pittsburgh, PA). This process removed the majority of cells adhered to the surface NATURE MATERIALS www.nature.com/naturematerials
2015 Macmillan Publishers Limited. All rights reserved In addition, to investigate fibrosis or the lack thereof in control (non-depleted) or induced into sets based on macrophage subtype and compartment. Data was normalized using the macrophage-depleted MAFIA mice, 0.5 mm SLG20 spheres were transplanted as described geometric means of the NanoString positive controls and background levels were established above. In the case of targeted macrophage depletion, an additional group of n = 5 mice were using the means of the negative controls. Housekeeping genes Tubb5, Hprt1, Bact, and Cltc were injected intravenously (tail vein) with B/B homodimerizer (Clontech). We achieved significant used to normalize between samples. Data was then log-transformed. For each subtype, time, and macrophage depletion ( 80-90%, mean group decrease = 84.36%, Supplemental Figure S13c)
compartment group, a two-way ANOVA for the effect of size blocking on genes was performed. following our administering of an intravenous injection of 10 mg/kg of the homodimerizer P-values were computed from pairwise comparisons performed using Tukey's Honest AP20187 in these mice. Repeat depletion in the MAFIA model three days prior and then once Significant Difference test and the Bonferroni correction was used to control the overall error every 3 days, starting 3 days following alginate sphere implantation up until retrieval, was able to knock down macrophage numbers far below peritoneal levels observed in the IP space of transplanted, non-depleted control MAFIA mice ( 65.26% vs 10.2%; Supplemental Figure
2. Supplemental Discussion
s. NanoString analysis Diffusion of insulin and glucose as a function of capsule geometry RNAs for mock-implanted/mock-treated (MT) controls, or for 0.5 or 1.5 mm alginate sphere- bearing mice (n = 4/group) were isolated from tissue samples taken at various time points after In beta-cells, glucose-induced insulin secretion is a complex process involving glucose implantation, as described. Respective RNAs were quantified, diluted to the appropriate metabolism, mitochondrial energy production, potassium-dependent ATP channels (KATP concentration (100 ng/µl), and then 500 ng of each sample was processed according to channels), voltage-dependent calcium channels (VDCCs), calcium influx, and insulin secretion, NanoString manufacturer protocols for expression analysis via our customized multiplexed gene which has a biphasic and oscillatory kinetic pattern5. In this study, we applied a microfluidic mouse macrophage subtyping panel. RNA levels (absolute copy numbers) were obtained perifusion device to dynamically measure intracellular calcium influx (a downstream and following nCounter (NanoString Technologies Inc., Seattle, WA) quantification, and group immediately proximal trigger for the fusion of insulin granules to the plasma membrane and samples were analyzed using nSolver analysis software (NanoString Technologies Inc., Seattle, exocytosis) and insulin concentrations in perifusate samples in order to characterize the impact of encapsulation and capsule size on insulin secretion coupling factors and insulin secretion. As shown in Supplemental Figure 11A, glucose-induced intracellular calcium signals were similar
t. Statistical analysis among the three groups with typical phase responses in all three groups. No significant Data are expressed as mean ± SEM, and N = 5 mice per time point and per treatment group. differences were observed from the start time of calcium influx up to the maximal calcium peak For Rat studies N = 3 per treatment. These sample sizes where chosen based on previous in response to both 20 mM glucose and 30 mM KCl (potassium chloride) challenge. Additionally, literature. All animals were included in analyses except in instances of unforeseen sickness or the areas under the curve (AUCs) of calcium concentrations under both stimulators were not morbidity. Animal cohorts where randomly selected. Investigators where not blind to performed significantly different (Supplemental Figure 11B). However, the time to reach the maximal
experiments. For qPCR or FACS, data were analyzed for statistical significance either by calcium level for the 1.5 mm capsules was statistically delayed in response to glucose compared unpaired, two-tailed t-test, or one-way ANOVA with Bonferroni multiple comparison correction, to the naked islets and 0.5 mm capsules (p = 0.03), but not statistically delayed in response to unless indicated otherwise, as implemented in GraphPad Prism 5; *: p < 0.05, **: p < 0.001, and KCl stimulation. ***: p < 0.0001. High throughput NanoString based gene expression analysis data was divided Our results suggest that small molecules, such as glucose (180.2 daltons) and KCl (74.6 daltons), diffuse very rapidly into the alginate capsules and efficiently induce calcium influx at a 2015 Macmillan Publishers Limited. All rights reserved In addition, to investigate fibrosis or the lack thereof in control (non-depleted) or induced into sets based on macrophage subtype and compartment. Data was normalized using the macrophage-depleted MAFIA mice, 0.5 mm SLG20 spheres were transplanted as described geometric means of the NanoString positive controls and background levels were established above. In the case of targeted macrophage depletion, an additional group of n = 5 mice were using the means of the negative controls. Housekeeping genes Tubb5, Hprt1, Bact, and Cltc were injected intravenously (tail vein) with B/B homodimerizer (Clontech). We achieved significant used to normalize between samples. Data was then log-transformed. For each subtype, time, and macrophage depletion ( 80-90%, mean group decrease = 84.36%, Supplemental Figure S13c)
compartment group, a two-way ANOVA for the effect of size blocking on genes was performed. following our administering of an intravenous injection of 10 mg/kg of the homodimerizer P-values were computed from pairwise comparisons performed using Tukey's Honest AP20187 in these mice. Repeat depletion in the MAFIA model three days prior and then once Significant Difference test and the Bonferroni correction was used to control the overall error every 3 days, starting 3 days following alginate sphere implantation up until retrieval, was able to knock down macrophage numbers far below peritoneal levels observed in the IP space of transplanted, non-depleted control MAFIA mice ( 65.26% vs 10.2%; Supplemental Figure
2. Supplemental Discussion
s. NanoString analysis Diffusion of insulin and glucose as a function of capsule geometry RNAs for mock-implanted/mock-treated (MT) controls, or for 0.5 or 1.5 mm alginate sphere- bearing mice (n = 4/group) were isolated from tissue samples taken at various time points after In beta-cells, glucose-induced insulin secretion is a complex process involving glucose implantation, as described. Respective RNAs were quantified, diluted to the appropriate metabolism, mitochondrial energy production, potassium-dependent ATP channels (KATP concentration (100 ng/µl), and then 500 ng of each sample was processed according to channels), voltage-dependent calcium channels (VDCCs), calcium influx, and insulin secretion, NanoString manufacturer protocols for expression analysis via our customized multiplexed gene which has a biphasic and oscillatory kinetic pattern5. In this study, we applied a microfluidic mouse macrophage subtyping panel. RNA levels (absolute copy numbers) were obtained perifusion device to dynamically measure intracellular calcium influx (a downstream and following nCounter (NanoString Technologies Inc., Seattle, WA) quantification, and group immediately proximal trigger for the fusion of insulin granules to the plasma membrane and samples were analyzed using nSolver analysis software (NanoString Technologies Inc., Seattle, exocytosis) and insulin concentrations in perifusate samples in order to characterize the impact of encapsulation and capsule size on insulin secretion coupling factors and insulin secretion. As shown in Supplemental Figure 11A, glucose-induced intracellular calcium signals were similar
t. Statistical analysis among the three groups with typical phase responses in all three groups. No significant Data are expressed as mean ± SEM, and N = 5 mice per time point and per treatment group. differences were observed from the start time of calcium influx up to the maximal calcium peak For Rat studies N = 3 per treatment. These sample sizes where chosen based on previous in response to both 20 mM glucose and 30 mM KCl (potassium chloride) challenge. Additionally, literature. All animals were included in analyses except in instances of unforeseen sickness or the areas under the curve (AUCs) of calcium concentrations under both stimulators were not morbidity. Animal cohorts where randomly selected. Investigators where not blind to performed significantly different (Supplemental Figure 11B). However, the time to reach the maximal
experiments. For qPCR or FACS, data were analyzed for statistical significance either by calcium level for the 1.5 mm capsules was statistically delayed in response to glucose compared unpaired, two-tailed t-test, or one-way ANOVA with Bonferroni multiple comparison correction, to the naked islets and 0.5 mm capsules (p = 0.03), but not statistically delayed in response to unless indicated otherwise, as implemented in GraphPad Prism 5; *: p < 0.05, **: p < 0.001, and KCl stimulation. ***: p < 0.0001. High throughput NanoString based gene expression analysis data was divided Our results suggest that small molecules, such as glucose (180.2 daltons) and KCl (74.6 daltons), diffuse very rapidly into the alginate capsules and efficiently induce calcium influx at a NATURE MATERIALS www.nature.com/naturematerials
2015 Macmillan Publishers Limited. All rights reserved similar rate as naked islets. This suggests that the encapsulation process and alginate material do in response to glucose. However, there is no significant difference in insulin secretory kinetics not acutely impede glucose metabolism or insulin stimulator-secretion coupling factors such as between 0.5 mm- and 1.5 mm-encapsulated islets, suggesting capsule size has little effect on mitochondrial energy production and ion channels that are important for in vitro and in vivo insulin secretion. function. Furthermore, diffusion efficiency in the capsule may depend on molecular weight of In summary, islet stimulation kinetics by small molecular weight secretagogues is unaffected the analyte since there was a delayed time to reach a maximal calcium level in the 1.5 mm by encapsulation or capsule size; however, initial insulin secretory kinetics are delayed similarly capsules in response to glucose (180.2 daltons), but not to KCl (74.6 daltons). for encapsulated islets at both capsule sizes. Nonetheless, overall bulk insulin kinetics for both Next, we investigated the insulin secretion kinetics of the naked and encapsulated islets. As capsule sizes are well-conserved and similar to naked islets. shown in Supplemental Figure 12A, naked islets show typical biphasic insulin secretion
patterns in response to glucose, while both encapsulated islet groups show loss of the biphasic
pattern showing that insulin secretion gradually increases over the period of glucose stimulation
without a defined phase I secretion. No significant differences were observed from the start time
of insulin secretion up to the maximal peak insulin secretion in response to both 20 mM glucose
and 30 mM KCl challenges. However, the times to reach maximal insulin secretion from 20 mM
glucose and 30 mM KCl were significantly delayed for 0.5 mm and 1.5 mm encapsulated islets
compared to naked islets (p = 0.0002 (20mM glucose), 0.04 (30 mM KCl)). Further analysis of
insulin secretory kinetic curves showed that the total insulin secreted by naked islets in the first
ten minutes of stimulation was significantly higher than for both 0.5 mm- and 1.5 mm-
encapsulated islets in responses to both glucose and KCl (p = 0.02 and 0.04, respectively), but
not significantly different for later time segments during stimulation. This data further suggests
that the larger molecular weight of the insulin (5,808 Da) is the determining factor resulting in
longer diffusion time through the alginate gel into the perifusate chamber for both encapsulated
groups compared to naked islets.
Total insulin secreted by all groups during stimulation (20-55 min) and during the wash out
period after stimulation (55-100 min) was also found not to be significantly different in response
to both stimulators (Supplemental Figure 12C and D). This suggests that overall bulk insulin
secretion is unaffected by encapsulation or capsule size. More importantly, encapsulated islets
returned to basal insulin secretory levels similar to naked islets, which is a critical factor when
considering future clinical application as prolonged insulin secretion after stimulation could
cause dangerous hypoglycemia.
Together with normal glucose-induced calcium influx, our results indicate that the altered
insulin secretion profiles of the encapsulated islets seem to be largely affected by the presence of
an alginate gel due to increasing diffusion time of larger MW insulin from the capsule to the
perifusate. This may explain the observed loss of phase I insulin secretion of encapsulated islets
NATURE MATERIALS www.nature.com/naturematerials
2015 Macmillan Publishers Limited. All rights reserved 3. Supplementary Tables:
Table S1. P-values indicating level of significance for comparisons between mock surgeries and
Table S2. Mouse (m) or rat (r)-specific (host) forward and reverse primer sets used for qPCR
implanted SLG20 spheres innate immune responses over time classified by macrophage markers, analysis of RNA levels. Gene names are also shown in parentheses. size, and days after implantation. Nanostring data was log-transformed and a linear model Primers (5' to 3'): Sense & Antisense consisting of time, size, gene, compartment, and macrophage type was constructed. Pairwise Mouse Collagen 1a1 Forward: 5'-CATGTTCAGCTTTGTGGACCT-3' comparisons between the mock and implanted groups were performed using Tukey's range test. (mCol1a1) Reverse: 5'-GCAGCTGACTTCAGGGATGT-3' Significance level α= 0.05. N=4 mice per treatment. For details of analysis see supplemental Mouse Collagen 1a2 Forward: 5'-GCAGGTTCACCTACTCTGTCCT-3' methods description. (mCol1a2) Reverse: 5'-CTTGCCCCATTCATTTGTCT-3' Mouse Alpha Smooth Forward: 5'-CGCTTCCGCTGCCCAGAGACT-3' Muscle actin (mActa2) Reverse: 5'-TATAGGTGGTTTCGTGGATGCCCGCT-3' Mouse Myeloid cell Forward: 5'-CCAAGAGAATGCAAAAGGCTTT-3' Intraperitoneal Regulatory 1.0000 1.0000 1.0000 1.0000 1.0000 1.0000 Reverse: 5'-GGGGGGCTGCAACAACCACA-3' 0.0041 <0.0001 (mItgam) Mouse Macrophage Forward: 5'-GCCCGAGTACAGTCTACCTGG-3' 1.0000 1.0000 0.2175 0.2302 0.0326 0.5249 marker CD68 (mCd68) Reverse: 5'-AGAGATGAATTCTGCGCCAT-3' Mouse neutrophil Forward: 5'-TGCCCCTTCTCTGATGGATT-3' marker Gr1 (mLy6g) Reverse: 5'-TGCTCTTGACTTTGCTTCTGTGA-3' 0.0001 1.0000 <0.0001 <0.0001 <0.0001 <0.0001 Mouse β-actin (mActB) Forward: 5'-GCTTCTTTGCAGCTCCTTCGTT-3' 0.5295 <0.0001 Reverse: 5'-CGGAGCCGTTGTCGACGACC-3' <0.0001 <0.0001 Rat Collagen 1a1 Forward: 5'-CATGTTCAGCTTTGTGGACCT-3' (rCol1a1) Reverse: 5'-GCAGCTGACTTCAGGGATGT-3' Rat Collagen 1a2 Forward: 5'-CCTGGCTCTCGAGGTGAAC-3' (rCol1a2) Reverse: 5'-CAATGCCCAGAGGACCAG-3' Rat Alpha Smooth Forward: 5'-TGCCATGTATGTGGCTATTCA-3' Muscle actin (rActa2) Reverse: 5'-ACCAGTTGTACGTCCAGAAGC-3' Rat Pdx1 (rPdx1) Forward: 5'-CTCTCGTGCCATGTGAACC-3' Reverse: 5'-TTCTCTAAATTGGTCCCAGGAA-3' Rat β-actin (rActB) Forward: 5'-ACCTTCTTGCAGCTCCTCCGTC-3' Reverse: 5'-CGGAGCCGTTGTCGACGACG-3' 2015 Macmillan Publishers Limited. All rights reserved 3. Supplementary Tables:
Table S1. P-values indicating level of significance for comparisons between mock surgeries and
Table S2. Mouse (m) or rat (r)-specific (host) forward and reverse primer sets used for qPCR
implanted SLG20 spheres innate immune responses over time classified by macrophage markers, analysis of RNA levels. Gene names are also shown in parentheses. size, and days after implantation. Nanostring data was log-transformed and a linear model Primers (5' to 3'): Sense & Antisense consisting of time, size, gene, compartment, and macrophage type was constructed. Pairwise Mouse Collagen 1a1 Forward: 5'-CATGTTCAGCTTTGTGGACCT-3' comparisons between the mock and implanted groups were performed using Tukey's range test. (mCol1a1) Reverse: 5'-GCAGCTGACTTCAGGGATGT-3' Significance level α= 0.05. N=4 mice per treatment. For details of analysis see supplemental Mouse Collagen 1a2 Forward: 5'-GCAGGTTCACCTACTCTGTCCT-3' methods description. (mCol1a2) Reverse: 5'-CTTGCCCCATTCATTTGTCT-3' Mouse Alpha Smooth Forward: 5'-CGCTTCCGCTGCCCAGAGACT-3' Muscle actin (mActa2) Reverse: 5'-TATAGGTGGTTTCGTGGATGCCCGCT-3' Mouse Myeloid cell Forward: 5'-CCAAGAGAATGCAAAAGGCTTT-3' Intraperitoneal Regulatory 1.0000 1.0000 1.0000 1.0000 1.0000 1.0000 Reverse: 5'-GGGGGGCTGCAACAACCACA-3' 0.0041 <0.0001 (mItgam) Mouse Macrophage Forward: 5'-GCCCGAGTACAGTCTACCTGG-3' 1.0000 1.0000 0.2175 0.2302 0.0326 0.5249 marker CD68 (mCd68) Reverse: 5'-AGAGATGAATTCTGCGCCAT-3' Mouse neutrophil Forward: 5'-TGCCCCTTCTCTGATGGATT-3' marker Gr1 (mLy6g) Reverse: 5'-TGCTCTTGACTTTGCTTCTGTGA-3' 0.0001 1.0000 <0.0001 <0.0001 <0.0001 <0.0001 Mouse β-actin (mActB) Forward: 5'-GCTTCTTTGCAGCTCCTTCGTT-3' 0.5295 <0.0001 Reverse: 5'-CGGAGCCGTTGTCGACGACC-3' <0.0001 <0.0001 Rat Collagen 1a1 Forward: 5'-CATGTTCAGCTTTGTGGACCT-3' (rCol1a1) Reverse: 5'-GCAGCTGACTTCAGGGATGT-3' Rat Collagen 1a2 Forward: 5'-CCTGGCTCTCGAGGTGAAC-3' (rCol1a2) Reverse: 5'-CAATGCCCAGAGGACCAG-3' Rat Alpha Smooth Forward: 5'-TGCCATGTATGTGGCTATTCA-3' Muscle actin (rActa2) Reverse: 5'-ACCAGTTGTACGTCCAGAAGC-3' Rat Pdx1 (rPdx1) Forward: 5'-CTCTCGTGCCATGTGAACC-3' Reverse: 5'-TTCTCTAAATTGGTCCCAGGAA-3' Rat β-actin (rActB) Forward: 5'-ACCTTCTTGCAGCTCCTCCGTC-3' Reverse: 5'-CGGAGCCGTTGTCGACGACG-3' NATURE MATERIALS www.nature.com/naturematerials
2015 Macmillan Publishers Limited. All rights reserved 4. Supplementary Figures:
Supplementary Figure S1. Alginate hydrogel microspheres of 8 sizes where prepared with
narrow size distributions. Box and whisker plot of measured sphere sizes determined through
measurement of 10 randomly selected spheres from each size group. Two different batches of
preparations were separately analyzed.
Supplemental Figure S2. H&E (left) and Masson's trichrome (right) staining of SLG20 alginate
hydrogel microspheres. Small (0.3 mm diameter) (top) and large (1 mm diameter) (bottom) sizes
retrieved after 14-day implantation in the intraperitoneal space of C57BL/6 mice; Scale bar = 1
mm. N=5 mice per treatment. Imaging experiments were repeated 3 times.
2015 Macmillan Publishers Limited. All rights reserved
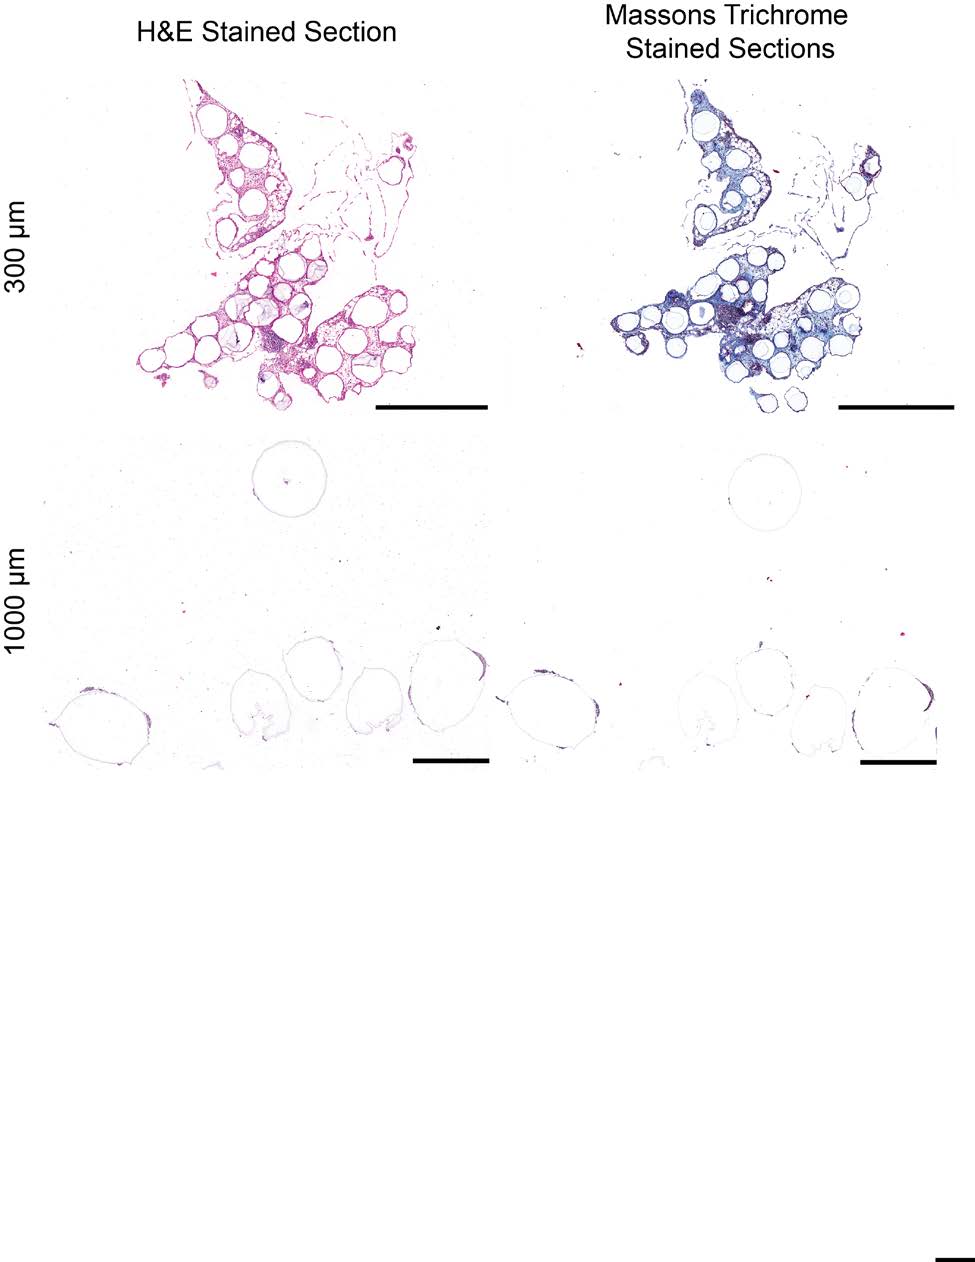
4. Supplementary Figures:
Supplementary Figure S1. Alginate hydrogel microspheres of 8 sizes where prepared with
narrow size distributions. Box and whisker plot of measured sphere sizes determined through
measurement of 10 randomly selected spheres from each size group. Two different batches of
preparations were separately analyzed.
Supplemental Figure S2. H&E (left) and Masson's trichrome (right) staining of SLG20 alginate
hydrogel microspheres. Small (0.3 mm diameter) (top) and large (1 mm diameter) (bottom) sizes
retrieved after 14-day implantation in the intraperitoneal space of C57BL/6 mice; Scale bar = 1
mm. N=5 mice per treatment. Imaging experiments were repeated 3 times.
NATURE MATERIALS www.nature.com/naturematerials
2015 Macmillan Publishers Limited. All rights reserved
Supplemental Figure S4. Phase contrast images from retrieved Ba-crosslinked SLG20 spheres
of 0.5 mm, and 1.5 mm diameter spheres normalized by equivalent total surface area implanted
into the intraperitoneal space of C57BL/6 mice. Note: to generate an equivalent surface area, 9
times fewer individual 1.5 mm spheres are needed than those for the 0.5 mm size; based on the
difference in volume between the 0.5 mm and 1.5 mm spheres (27-fold greater for the 1.5 mm
size), this numerical difference translated into a net 3-fold greater total implant volume (300 µl
vs 100 µl) for the 1.5 mm spheres over that for the 0.5 spheres. Images obtained from all spheres
retrieved from individual mice (n = 5/group). Medium (0.5 mm) spheres were heavily clumped
and fibrosed, and large (1.5 mm) spheres were clear/translucent, due to a lack of visible fibrotic
deposition. The same material volume of hydrogel spheres was implanted into each mouse (n =
5/group) in all cases. Scale bar = 2 mm. Experiments were repeated twice.
Supplemental Figure S3. Immunofluorescence confocal images of SLG20 alginate hydrogel
microspheres of small (0.3 mm), medium (0.5 mm), and large (1 mm) sizes retrieved after a 14-
day implantation into the intraperitoneal space of C57BL/6 mice. In all cases, staining for cell
nuclei (DAPI, blue) and fibrosis-associated activated myofibroblasts (α-SMA, red) was
performed, rotating (green) stains for macrophages (CD68) (a), neutrophils (Ly6G/Ly6C Gr-1)
(b), or Tumor Growth Factor β (TGFβ) (c), as noted. Scale bar = 300 µm. N=5 mice per
treatment. Imaging experiments were repeated 3 times.
2015 Macmillan Publishers Limited. All rights reserved
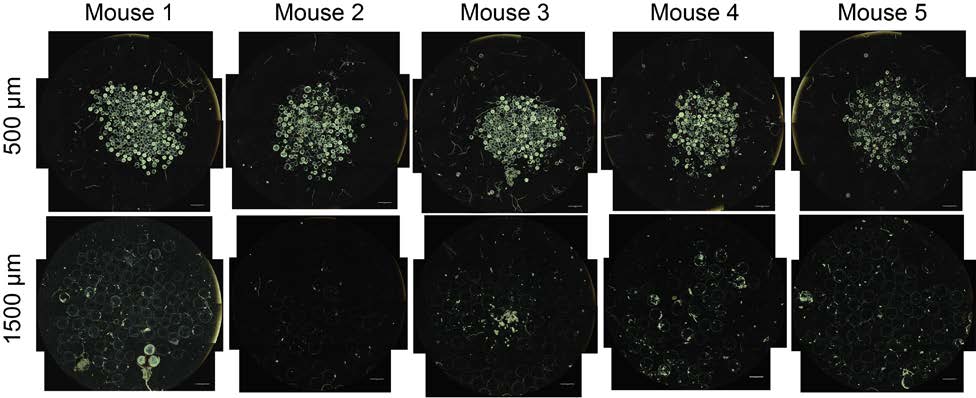
Supplemental Figure S4. Phase contrast images from retrieved Ba-crosslinked SLG20 spheres
of 0.5 mm, and 1.5 mm diameter spheres normalized by equivalent total surface area implanted
into the intraperitoneal space of C57BL/6 mice. Note: to generate an equivalent surface area, 9
times fewer individual 1.5 mm spheres are needed than those for the 0.5 mm size; based on the
difference in volume between the 0.5 mm and 1.5 mm spheres (27-fold greater for the 1.5 mm
size), this numerical difference translated into a net 3-fold greater total implant volume (300 µl
vs 100 µl) for the 1.5 mm spheres over that for the 0.5 spheres. Images obtained from all spheres
retrieved from individual mice (n = 5/group). Medium (0.5 mm) spheres were heavily clumped
and fibrosed, and large (1.5 mm) spheres were clear/translucent, due to a lack of visible fibrotic
deposition. The same material volume of hydrogel spheres was implanted into each mouse (n =
5/group) in all cases. Scale bar = 2 mm. Experiments were repeated twice.
Supplemental Figure S3. Immunofluorescence confocal images of SLG20 alginate hydrogel
microspheres of small (0.3 mm), medium (0.5 mm), and large (1 mm) sizes retrieved after a 14-
day implantation into the intraperitoneal space of C57BL/6 mice. In all cases, staining for cell
nuclei (DAPI, blue) and fibrosis-associated activated myofibroblasts (α-SMA, red) was
performed, rotating (green) stains for macrophages (CD68) (a), neutrophils (Ly6G/Ly6C Gr-1)
(b), or Tumor Growth Factor β (TGFβ) (c), as noted. Scale bar = 300 µm. N=5 mice per
treatment. Imaging experiments were repeated 3 times.
NATURE MATERIALS www.nature.com/naturematerials
2015 Macmillan Publishers Limited. All rights reserved
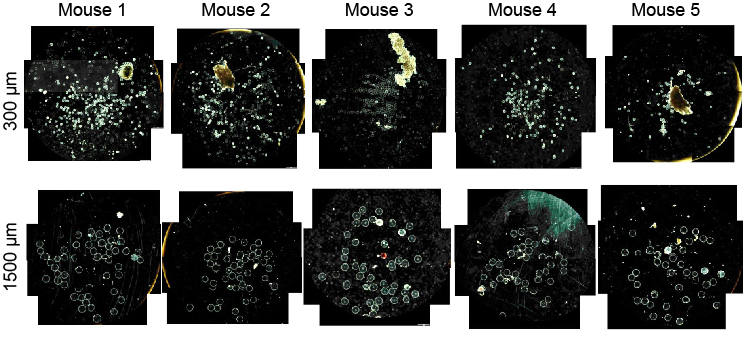
Supplemental Figure S5. Phase contrast images from retrieved Ba-crosslinked SLG20
microspheres of small (0.3 mm), and large (1.5 mm) sizes 6 months post-intraperitoneal implant
into C57BL/6 mice. Small (0.3 mm) spheres were heavily clumped and fibrosed, and large (1.5
mm) spheres were clear/translucent, due to a lack of visible fibrotic deposition. The same
material volume of hydrogel spheres was implanted into each mouse (n = 5/group) in all cases.
Supplemental Figure S6. qPCR panels showing that the effect of increased size in reducing
Scale bar = 2 mm. Experiments were repeated twice.
foreign body responses expands across a spectrum of materials including hydrogels, plastics,
metals, and ceramics. Medium (MED, 0.4-0.6 mm) or large sized (LG, 1.5-2.5 mm) spheres
were implanted into the intraperitoneal space of C57BL/6 mice. All materials were then
retrieved 14 days post-implant, and levels of different innate immune and fibrosis markers were
assayed by gene expression. CD68, macrophage marker; Ly6g/Gr1, neutrophil marker; CD11b,
myeloid cell marker; and Col1a1, collagen marker. Materials: SLG20 (chemically purified
alginate), LF10/60 (non-purified, endotoxin-containing alginate), polymers polystyrene (PS) and
PCL (polycaprolactone), silica-based ceramic glass, and stainless steel (SS). Note on plots NT= No treatment, and MT= Mock Treatment (i.e. PBS injection alone). Error bars, mean ± SEM. N=5 mice per treatment. qPCR statistical analysis: one-way ANOVA with Bonferroni multiple comparison correction *: p < 0.05, **: p < 0.001, and ***: p < 0.0001, comparing MED vs. LG. Experiments were repeated twice.
2015 Macmillan Publishers Limited. All rights reserved
Supplemental Figure S5. Phase contrast images from retrieved Ba-crosslinked SLG20
microspheres of small (0.3 mm), and large (1.5 mm) sizes 6 months post-intraperitoneal implant
into C57BL/6 mice. Small (0.3 mm) spheres were heavily clumped and fibrosed, and large (1.5
mm) spheres were clear/translucent, due to a lack of visible fibrotic deposition. The same
material volume of hydrogel spheres was implanted into each mouse (n = 5/group) in all cases.
Supplemental Figure S6. qPCR panels showing that the effect of increased size in reducing
Scale bar = 2 mm. Experiments were repeated twice.
foreign body responses expands across a spectrum of materials including hydrogels, plastics,
metals, and ceramics. Medium (MED, 0.4-0.6 mm) or large sized (LG, 1.5-2.5 mm) spheres
were implanted into the intraperitoneal space of C57BL/6 mice. All materials were then
retrieved 14 days post-implant, and levels of different innate immune and fibrosis markers were
assayed by gene expression. CD68, macrophage marker; Ly6g/Gr1, neutrophil marker; CD11b,
myeloid cell marker; and Col1a1, collagen marker. Materials: SLG20 (chemically purified
alginate), LF10/60 (non-purified, endotoxin-containing alginate), polymers polystyrene (PS) and
PCL (polycaprolactone), silica-based ceramic glass, and stainless steel (SS). Note on plots NT= No treatment, and MT= Mock Treatment (i.e. PBS injection alone). Error bars, mean ± SEM. N=5 mice per treatment. qPCR statistical analysis: one-way ANOVA with Bonferroni multiple comparison correction *: p < 0.05, **: p < 0.001, and ***: p < 0.0001, comparing MED vs. LG. Experiments were repeated twice.
NATURE MATERIALS www.nature.com/naturematerials
2015 Macmillan Publishers Limited. All rights reserved
Supplemental Figure S8. Photographs of tissue punches and retrieved alginate spheres from the
subcutaneous space of non-human primates (NHPs). Large 1.5 mm-sized spheres of SLG20
Supplemental Figure S7. Fibrosis deposition onto medium (0.5 mm) and large sized (2mm)
hydrogels implanted subcutaneously in the dorsal region of cynomolgus macaques resist fibrosis,
glass microspheres implanted into the peritoneal cavity of Sprague-Dawley rats and retrieved
while small spheres (0.5 mm sized) and cylinders (4 mm in diameter and 2 mm in height)
after two 2 weeks. Representative brightfield images of retrieved spheres showing extensive
became fibrosed. After 14 and 28 days 8 mm biopsy punches were used to excise implanted
fibrotic/cellular overgrowth; scale bars = 2 mm (a). Representative immunofluorescence Z-
materials along with peripheral host tissue. a, 4-step process for tissue/sample retrieval: 1) 8 mm
stacked confocal image of microspheres Stains used: for cell nuclei (DAPI, blue), macrophages
biopsy punch (after which large 1.5 mm spheres freely came out around the still present biopsied
(CD68, green) and fibrosis-associated activated myofibroblasts (α-SMA, red) (b). q-PCR based
tissue core, due to lack of encapsulation), 2) removal of biopsy core (where the majority of the
expression analysis of fibrotic markers α-SMA, Collagen 1a1 (Col1a1), and Collagen 1a2
large 1.5 mm spheres were present as a flat (non-encapsulated) layer, which upon removal using
(Col1a2) directly on medium and large sized glass microspheres plotted normalized to relative
forceps (step 3) came out freely, and following subsequent washing in sterile saline to also
expression levels onto medium sized spheres (c). Error bars, mean ± SEM. N=3 rats per
remove blood from the fresh punch (step 4) appeared clear and easily dissociated away from one
treatment. qPCR statistical analysis: one-way ANOVA with Bonferroni multiple comparison
another. b-c, Clean 1.5 mm sphere-8 mm-biopsy cores (days 14 & 28 post-implant). d,
correction **: p < 0.001, comparing Med vs. Large.
Retrieved large SLG20 hydrogels appeared transparent and void of cellular deposition. e-f, Free
2015 Macmillan Publishers Limited. All rights reserved
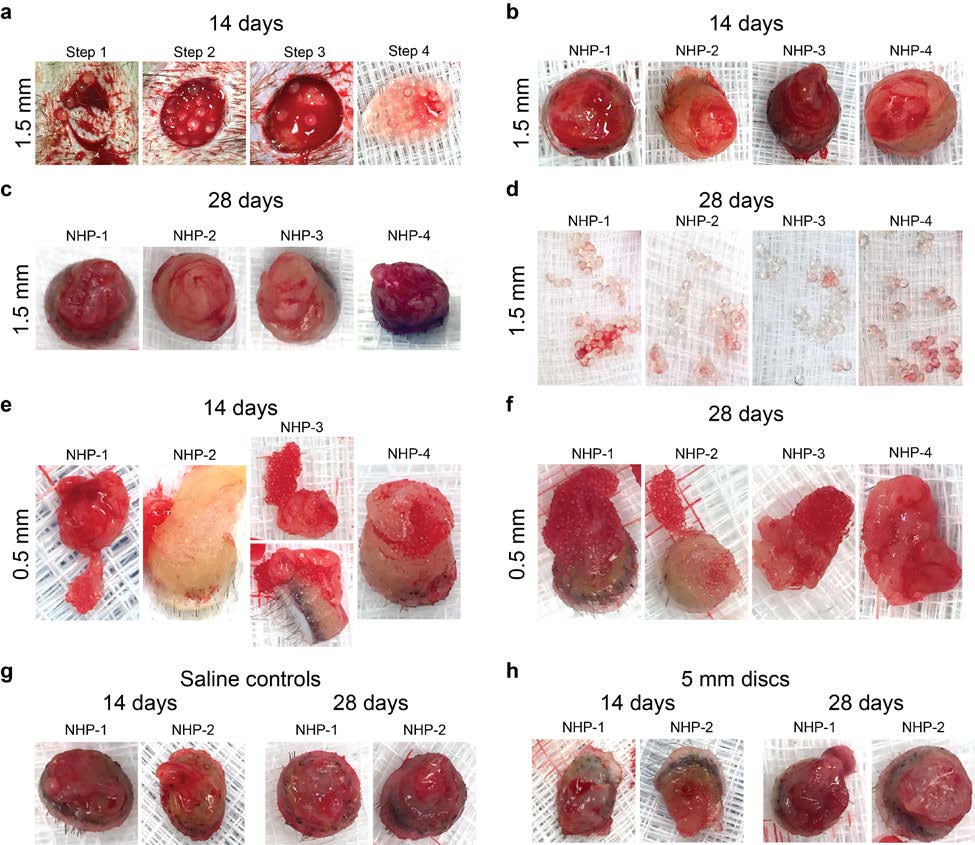
Supplemental Figure S8. Photographs of tissue punches and retrieved alginate spheres from the
subcutaneous space of non-human primates (NHPs). Large 1.5 mm-sized spheres of SLG20
Supplemental Figure S7. Fibrosis deposition onto medium (0.5 mm) and large sized (2mm)
hydrogels implanted subcutaneously in the dorsal region of cynomolgus macaques resist fibrosis,
glass microspheres implanted into the peritoneal cavity of Sprague-Dawley rats and retrieved
while small spheres (0.5 mm sized) and cylinders (4 mm in diameter and 2 mm in height)
after two 2 weeks. Representative brightfield images of retrieved spheres showing extensive
became fibrosed. After 14 and 28 days 8 mm biopsy punches were used to excise implanted
fibrotic/cellular overgrowth; scale bars = 2 mm (a). Representative immunofluorescence Z-
materials along with peripheral host tissue. a, 4-step process for tissue/sample retrieval: 1) 8 mm
stacked confocal image of microspheres Stains used: for cell nuclei (DAPI, blue), macrophages
biopsy punch (after which large 1.5 mm spheres freely came out around the still present biopsied
(CD68, green) and fibrosis-associated activated myofibroblasts (α-SMA, red) (b). q-PCR based
tissue core, due to lack of encapsulation), 2) removal of biopsy core (where the majority of the
expression analysis of fibrotic markers α-SMA, Collagen 1a1 (Col1a1), and Collagen 1a2
large 1.5 mm spheres were present as a flat (non-encapsulated) layer, which upon removal using
(Col1a2) directly on medium and large sized glass microspheres plotted normalized to relative
forceps (step 3) came out freely, and following subsequent washing in sterile saline to also
expression levels onto medium sized spheres (c). Error bars, mean ± SEM. N=3 rats per
remove blood from the fresh punch (step 4) appeared clear and easily dissociated away from one
treatment. qPCR statistical analysis: one-way ANOVA with Bonferroni multiple comparison
another. b-c, Clean 1.5 mm sphere-8 mm-biopsy cores (days 14 & 28 post-implant). d,
correction **: p < 0.001, comparing Med vs. Large.
Retrieved large SLG20 hydrogels appeared transparent and void of cellular deposition. e-f, Free
NATURE MATERIALS www.nature.com/naturematerials
2015 Macmillan Publishers Limited. All rights reserved
and non-fibrosed 1.5 mm spheres were separate from any host subcutaneous tissue following a
28-day implantation into the subcutaneous space of n = 4 different non-human primates. 0.5 mm
spheres were fibrosed to and embedded in 8 mm-biopsy cores at both 14 and 28 days following
implantation into 4 individual primates. g, 8 mm punches from NHPs receiving (negative)
control subcutaneous saline injections were clean and appeared to be similar to those taken from
sites receiving large 1.5 mm SLG20 spheres following both 14 and 28 days (b-c), n = 2 NHPs. h,
4 mm diameter cylinders were implanted subcutaneously and appear as positive fibrosis controls,
as they were heavily embedded in subsequently retrieved biopsy punches, at both 14 and 28 days
post-implant (n = 2 NHPs). This finding suggests that just increasing implant size is insufficient
to resist foreign body responses, and that a spherical shape is also integral for resisting host
fibrosis/rejection.
NATURE MATERIALS www.nature.com/naturematerials
2015 Macmillan Publishers Limited. All rights reserved
Supplemental Figure S9. Laparoscopic imaging during multiple minimally invasive procedures
(one implantation at day 0 and one retrieval at 2 weeks post-implant) for analysis of medium and
large SLG20 spheres delivered into the intraperitoneal space of non-human (cynomolgus
macaque) monkeys (a). Medium (0.5 mm) spheres were almost completely embedded into
omental fat tissue, whereas most large (1.5 mm) spheres were free, and often found at the bottom
basement of the intraperitoneal cavity. Dark-field phase contrast (scale bar = 2 mm) (b) and z-
stacked confocal image (c) of retrieved spheres following 2 weeks in the intraperitoneal space
showing little cellular deposition; In c Blue: (DAPI); Green: macrophage (CD68), Magenta
(CD11b) and Red: myofibroblast (SMA). Scale bar = 200 µm. (d) H&E and Masson's
Trichrome histological analysis performed on omental tissues excised 4 weeks post-implantation
confirmed the observed largescale adhesion and omental sequestration of medium (0.5 mm)
alginate spheres, as shown in the laparoscopic images in panel a. Green arrows: embedded
medium spheres; Yellow arrows: normal omental fat/adipocyte tissue morphology. (n = 2). 2
left images: 4X, 2 right: 10X.
Supplemental Figure S10. Intracellular calcium influx in response to insulin secretagogues.
Representative traces of intracellular calcium of single rat islets in response to 20 mM glucose
and 30 mM KCl (potassium chloride) stimulus (A). Average AUC [Ca2+]i % of calcium influx in
response to 20 mM or 2 mM glucose and 30 mM KCl. Naked n = 59; 0.5 mm n = 49; 1.5 mm n =
43. Mean ± SEM (B).
NATURE MATERIALS www.nature.com/naturematerials
2015 Macmillan Publishers Limited. All rights reserved
Figure S12. Individual BG correction plots comparing the efficacy of 0.5 mm and 1.5 mm
alginate capsules encapsulating rat islets (500 IE's) in curing STZ-induced C57BL/6 diabetic
mice. Individual blood glucose curves showing (a) only short-lived success with medium 0.5
mm diameter capsules, versus (b) prolonged normoglycemia with large 1.5 mm diameter
hydrogel alginate capsules. Mean average plots are shown in the main manuscript Figure 4. n =
5-7; repeated twice.
Supplemental Figure S11. Insulin secretion kinetics in response to insulin secretagogues.
Average insulin secretion kinetics in response to 20 mM glucose (A). Average insulin secretion
kinetics in response to 30 mM KCl (potassium chloride) (B). Average AUC [Insulin/10 islets]
secreted in response to 20 mM glucose (C). Average AUC [Insulin/10 islets] secreted in
response to 30 mM KCl. (n = 3 groups, each group 50 islets, Mean ± SD) (D).
2015 Macmillan Publishers Limited. All rights reserved
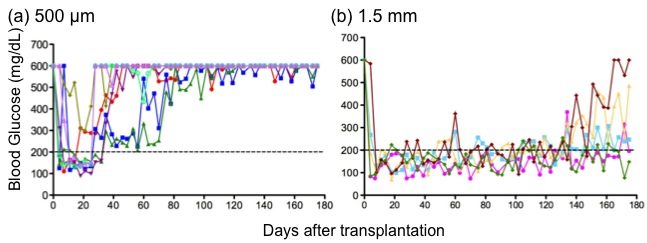
Figure S12. Individual BG correction plots comparing the efficacy of 0.5 mm and 1.5 mm
alginate capsules encapsulating rat islets (500 IE's) in curing STZ-induced C57BL/6 diabetic
mice. Individual blood glucose curves showing (a) only short-lived success with medium 0.5
mm diameter capsules, versus (b) prolonged normoglycemia with large 1.5 mm diameter
hydrogel alginate capsules. Mean average plots are shown in the main manuscript Figure 4. n =
5-7; repeated twice.
Supplemental Figure S11. Insulin secretion kinetics in response to insulin secretagogues.
Average insulin secretion kinetics in response to 20 mM glucose (A). Average insulin secretion
kinetics in response to 30 mM KCl (potassium chloride) (B). Average AUC [Insulin/10 islets]
secreted in response to 20 mM glucose (C). Average AUC [Insulin/10 islets] secreted in
response to 30 mM KCl. (n = 3 groups, each group 50 islets, Mean ± SD) (D).
NATURE MATERIALS www.nature.com/naturematerials
2015 Macmillan Publishers Limited. All rights reserved
Supplemental Figure S14. Preparation of mice for intravital imaging. The flow of processes
involved in preparing mice for implantation with alginate hydrogel spheres, loaded with quantum
dots, for in vivo intravital fluorescence imaging of macrophage recruitment around and onto
implanted spheres.
Figure S13. Phase contrast images and FACS data from retrieved Ba-crosslinked SLG20
microspheres of medium (0.5 mm) size 14 days post-intraperitoneal implant into transgenic
MAFIA-C57BL/6 mice (non-depleted vs macrophage depleted). Spheres in the control (non-
macrophage-depleted) group were heavily clumped and fibrosed (a), whereas spheres were
clear/translucent, due to a lack of visible fibrotic deposition, in the homodimerizer-induced
macrophage depleted treatment group (b). The same material volume of hydrogel spheres was
implanted into each mouse (n = 5/group) in all cases. Experiments were repeated twice. We
achieved significant macrophage depletion (c) ( 80-90%, mean group decrease = 84.36%)
following iv administration of 10 mg/kg of the homodimerizer AP20187 in these
mice. Macrophage numbers were knocked down far below peritoneal levels observed in the IP
space of SLG20-implanted, non-depleted control MAFIA mice ( 65.26% vs 10.2%).
2015 Macmillan Publishers Limited. All rights reserved
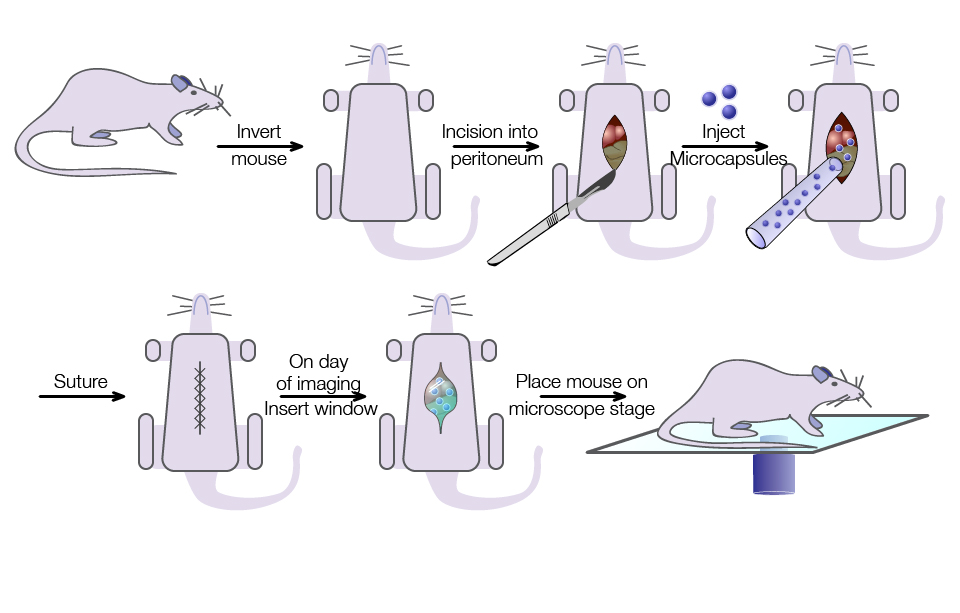
Supplemental Figure S14. Preparation of mice for intravital imaging. The flow of processes
involved in preparing mice for implantation with alginate hydrogel spheres, loaded with quantum
dots, for in vivo intravital fluorescence imaging of macrophage recruitment around and onto
implanted spheres.
Figure S13. Phase contrast images and FACS data from retrieved Ba-crosslinked SLG20
microspheres of medium (0.5 mm) size 14 days post-intraperitoneal implant into transgenic
MAFIA-C57BL/6 mice (non-depleted vs macrophage depleted). Spheres in the control (non-
macrophage-depleted) group were heavily clumped and fibrosed (a), whereas spheres were
clear/translucent, due to a lack of visible fibrotic deposition, in the homodimerizer-induced
macrophage depleted treatment group (b). The same material volume of hydrogel spheres was
implanted into each mouse (n = 5/group) in all cases. Experiments were repeated twice. We
achieved significant macrophage depletion (c) ( 80-90%, mean group decrease = 84.36%)
following iv administration of 10 mg/kg of the homodimerizer AP20187 in these
mice. Macrophage numbers were knocked down far below peritoneal levels observed in the IP
space of SLG20-implanted, non-depleted control MAFIA mice ( 65.26% vs 10.2%).
NATURE MATERIALS www.nature.com/naturematerials
2015 Macmillan Publishers Limited. All rights reserved
Supplemental Figure S15. Profiling macrophage phenotype shifts in the cells of the
Supplemental Figure S16. Profiling macrophage phenotype shifts in the cell of the peripheral
intraperitoneal space. NanoString-based analysis for RNA expression of macrophage phenotype
omentum fat tissue. NanoString-based analysis for RNA expression of macrophage phenotype
markers from cells in the intraperitoneal space extracted (intraperitoneal lavaged) at 1, 4, and 7
markers from cells in the peripheral fat tissue extracted at 1, 4, and 7 days post-implant.
days post-implant. Expression is normalized to intraperitoneal cells harvested from mock surgery
Expression is normalized to fat tissue harvested from mock surgery (PBS-injected) mice,
(PBS-injected) mice, presented on a base 2 logarithmic scale. N=4 mice per treatment. For
presented on a base 2 logarithmic scale. N=4 mice per treatment. For details of analysis see
details of analysis see supplemental methods description.
supplemental methods description.
NATURE MATERIALS www.nature.com/naturematerials
2015 Macmillan Publishers Limited. All rights reserved
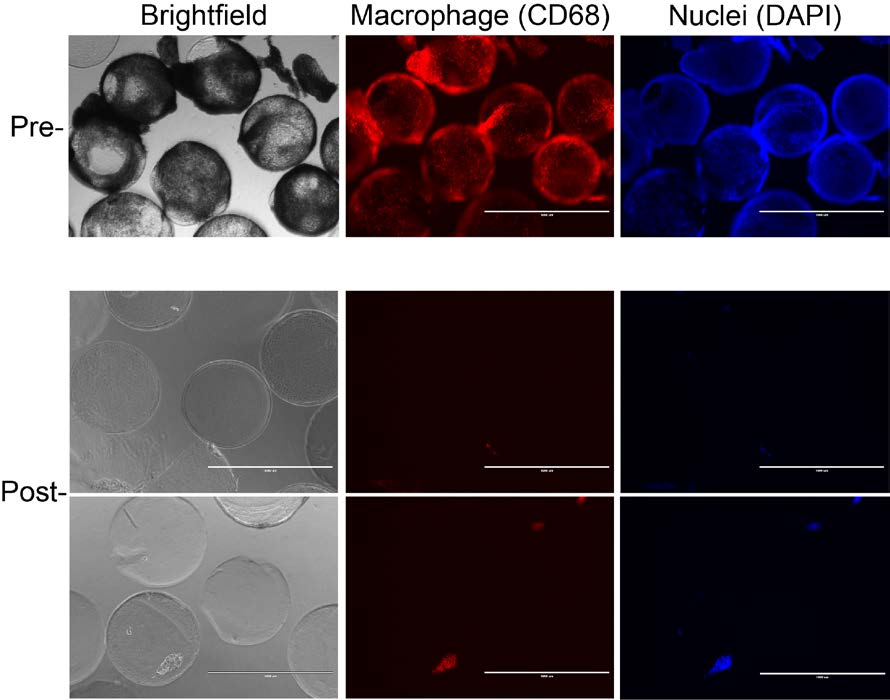
5. Supplemental Video Legends:
Supplemental Video V1. Laparoscopic video taken during a minimally invasive procedure (at 2
weeks post-implant) for analysis of medium SLG20 spheres delivered into the intraperitoneal
space of non-human (cynomolgus macaque) monkeys. Medium (0.5 mm) spheres were almost
completely embedded into omental fat tissue, whereas most large (1.5 mm) spheres were free,
and often found at the bottom basement of the intraperitoneal cavity (Supplemental Video V2).
An IP lavage with saline at 14 days post implantation was unsuccessful at retrieving 0.5 mm
sized spheres due to strong adherence and embedding into the IP host tissue (omentum).
Supplemental Video V2. Laparoscopic video taken during a minimally invasive procedure (at 2
weeks post-implant) for analysis of large SLG20 spheres delivered into the intraperitoneal space
of non-human (cynomolgus macaque) monkeys. Medium (0.5 mm) spheres were almost
completely embedded into omental fat tissue (Supplemental Video V1), whereas most large (1.5
mm) spheres were free, and often found at the bottom basement of the intraperitoneal cavity. An
IP lavage with saline at 14 days post implantation enabled significant retrieval of SLG20 1.5 mm
Supplemental Video V3. In vivo intravital imaging of macrophage behavior and accumulation
at 1 day post-implantation to understand kinetics of host response to SLG20 alginate
microspheres of 0.5 mm sizes in diameter, confirms significant macrophage activity and numbers
around 0.5 mm sized capsules. N = 3 mice per treatment. Intravital imaging experiments were
performed twice.
Supplemental Video V4. In vivo intravital imaging of macrophage behavior and accumulation
at 1 day post-implantation to understand kinetics of host response to SLG20 alginate
Supplemental Figure S17. Cell dissociation protocol efficacy. To confirm the efficacy of cell
microspheres of 1.5 mm sizes in diameter, confirms a lack of macrophage activity and numbers
removal we did a pilot study were by we immunostained capsules retrieved after a 14-day
surrounding 1.5 mm size capsules. N = 3 mice per treatment. Intravital imaging experiments
were performed twice.
implantation in the IP space both before (Pre-, top) and after (Post-, bottom) employing our
passive cell dissociation protocol (as described in the FACS methods section above). Limited
Supplemental Video V5. In vivo intravital imaging of macrophage behavior and accumulation
at 4 day post-implantation to understand kinetics of host response to SLG20 alginate
cells remain on capsules after employing this technique, which removed the majority of cells
microspheres of 0.5 mm sizes in diameter, confirms significant increases and expansion in
(>90%) adhered to the implanted material.
macrophage activity and numbers around 0.5 mm sized capsules. N = 3 mice per treatment.
Intravital imaging experiments were performed twice.
Supplemental Video V6. In vivo intravital imaging of macrophage behavior and accumulation
at 4 day post-implantation to understand kinetics of host response to SLG20 alginate
microspheres of 1.5 mm sizes in diameter, confirms a prolonged lack of macrophage activity and
numbers surrounding 1.5 mm size capsules. N = 3 mice per treatment. Intravital imaging
experiments were performed twice.
Supplemental Video V7. In vivo intravital imaging of macrophage behavior and accumulation
at 7 day post-implantation to understand kinetics of host response to SLG20 alginate
microspheres of 0.5 mm sizes in diameter, confirms significant and continued increases and
expansion in macrophage activity. N = 3 mice per treatment. Intravital imaging experiments
were performed twice.
2015 Macmillan Publishers Limited. All rights reserved
5. Supplemental Video Legends:
Supplemental Video V1. Laparoscopic video taken during a minimally invasive procedure (at 2
weeks post-implant) for analysis of medium SLG20 spheres delivered into the intraperitoneal
space of non-human (cynomolgus macaque) monkeys. Medium (0.5 mm) spheres were almost
completely embedded into omental fat tissue, whereas most large (1.5 mm) spheres were free,
and often found at the bottom basement of the intraperitoneal cavity (Supplemental Video V2).
An IP lavage with saline at 14 days post implantation was unsuccessful at retrieving 0.5 mm
sized spheres due to strong adherence and embedding into the IP host tissue (omentum).
Supplemental Video V2. Laparoscopic video taken during a minimally invasive procedure (at 2
weeks post-implant) for analysis of large SLG20 spheres delivered into the intraperitoneal space
of non-human (cynomolgus macaque) monkeys. Medium (0.5 mm) spheres were almost
completely embedded into omental fat tissue (Supplemental Video V1), whereas most large (1.5
mm) spheres were free, and often found at the bottom basement of the intraperitoneal cavity. An
IP lavage with saline at 14 days post implantation enabled significant retrieval of SLG20 1.5 mm
Supplemental Video V3. In vivo intravital imaging of macrophage behavior and accumulation
at 1 day post-implantation to understand kinetics of host response to SLG20 alginate
microspheres of 0.5 mm sizes in diameter, confirms significant macrophage activity and numbers
around 0.5 mm sized capsules. N = 3 mice per treatment. Intravital imaging experiments were
performed twice.
Supplemental Video V4. In vivo intravital imaging of macrophage behavior and accumulation
at 1 day post-implantation to understand kinetics of host response to SLG20 alginate
Supplemental Figure S17. Cell dissociation protocol efficacy. To confirm the efficacy of cell
microspheres of 1.5 mm sizes in diameter, confirms a lack of macrophage activity and numbers
removal we did a pilot study were by we immunostained capsules retrieved after a 14-day
surrounding 1.5 mm size capsules. N = 3 mice per treatment. Intravital imaging experiments
were performed twice.
implantation in the IP space both before (Pre-, top) and after (Post-, bottom) employing our
passive cell dissociation protocol (as described in the FACS methods section above). Limited
Supplemental Video V5. In vivo intravital imaging of macrophage behavior and accumulation
at 4 day post-implantation to understand kinetics of host response to SLG20 alginate
cells remain on capsules after employing this technique, which removed the majority of cells
microspheres of 0.5 mm sizes in diameter, confirms significant increases and expansion in
(>90%) adhered to the implanted material.
macrophage activity and numbers around 0.5 mm sized capsules. N = 3 mice per treatment.
Intravital imaging experiments were performed twice.
Supplemental Video V6. In vivo intravital imaging of macrophage behavior and accumulation
at 4 day post-implantation to understand kinetics of host response to SLG20 alginate
microspheres of 1.5 mm sizes in diameter, confirms a prolonged lack of macrophage activity and
numbers surrounding 1.5 mm size capsules. N = 3 mice per treatment. Intravital imaging
experiments were performed twice.
Supplemental Video V7. In vivo intravital imaging of macrophage behavior and accumulation
at 7 day post-implantation to understand kinetics of host response to SLG20 alginate
microspheres of 0.5 mm sizes in diameter, confirms significant and continued increases and
expansion in macrophage activity. N = 3 mice per treatment. Intravital imaging experiments
were performed twice.
NATURE MA
TERIALS www.nature.com/naturematerials
2015 Macmillan Publishers Limited. All rights reserved
Supplemental Video V8. In vivo intravital imaging of macrophage behavior and accumulation
at 7 day post-implantation to understand kinetics of host response to SLG20 alginate
microspheres of 1.5 mm sizes in diameter, confirms a lack of macrophage activity and numbers
surrounding 1.5 mm size capsules even 7 days post-implantation. N = 3 mice per treatment.
Intravital imaging experiments were performed twice.
6. Supplementary References:
1.
Morch YA, Donati I, Strand BL, Skjak-‐Braek G. Effect of Ca2+, Ba2+, and Sr2+ on
alginate microbeads. Biomacromolecules 2006, 7(5): 1471-‐1480.
Lacy PE, Kostianovsky M. Method for the isolation of intact islets of Langerhans from
the rat pancreas. Diabetes 1967, 16(1): 35-‐39.
Ricordi C, Gray DW, Hering BJ, Kaufman DB, Warnock GL, Kneteman NM, et al. Islet
isolation assessment in man and large animals. Acta Diabetol Lat 1990, 27(3): 185-‐
Adewola AF, Lee D, Harvat T, Mohammed J, Eddington DT, Oberholzer J, et al.
Microfluidic perifusion and imaging device for multi-‐parametric islet function
assessment. Biomedical microdevices 2010, 12(3): 409-‐417.
Keizer J, Magnus G. ATP-‐sensitive potassium channel and bursting in the pancreatic
beta cell. A theoretical study. Biophysical journal 1989, 56(2): 229-‐242.
2015 Macmillan Publishers Limited. All rights reserved
Source: http://www.cukrovkanf.sk/wp-content/uploads/2015/06/nmat4290-s1-SUPPL-INFO.pdf
Building the process-drug–side effect network to discover the relationship between biological processes and side effects
Lee et al. BMC Bioinformatics 2011, 12(Suppl 2):S2http://www.biomedcentral.com/1471-2105/12/S2/S2 Building the process-drug–side effect network todiscover the relationship between biologicalProcesses and side effects Sejoon Lee1, Kwang H Lee1, Min Song2*, Doheon Lee1* From Fourth International Workshop on Data and Text Mining in Biomedical Informatics (DTMBio) 2010Toronto, Canada. 26 October 2010
mfa.gouv.qc.ca
PROTOCOL FOR THE ADMINISTRATION OF ACETAMINOPHEN TO TREAT FEVER Acetaminophen is the generic name of the pharmaceutical product sold commercially under the brand names AtasolTM, TempraTM, TylenolTM and other private labels. Acetaminophen has analgesic (pain-reducing) and antipyretic (fever-preventing and fever-reducing) properties. It does not have anti-inflammatory properties. Although it is an over-the-counter medication,