Building the process-drug–side effect network to discover the relationship between biological processes and side effects
Lee et al. BMC Bioinformatics 2011, 12(Suppl 2):S2http://www.biomedcentral.com/1471-2105/12/S2/S2 Building the process-drug–side effect network todiscover the relationship between biologicalProcesses and side effects Sejoon Lee1, Kwang H Lee1, Min Song2*, Doheon Lee1* From Fourth International Workshop on Data and Text Mining in Biomedical Informatics (DTMBio) 2010Toronto, Canada. 26 October 2010 Background: Side effects are unwanted responses to drug treatment and are important resources for humanphenotype information. The recent development of a database on side effects, the side effect resource (SIDER), is afirst step in documenting the relationship between drugs and their side effects. It is, however, insufficient to simplyfind the association of drugs with biological processes; that relationship is crucial because drugs that influencebiological processes can have an impact on phenotype. Therefore, knowing which processes respond to drugs thatinfluence the phenotype will enable more effective and systematic study of the effect of drugs on phenotype. Tothe best of our knowledge, the relationship between biological processes and side effects of drugs has not yetbeen systematically researched.Methods: We propose 3 steps for systematically searching relationships between drugs and biologicalprocesses: enrichment scores (ES) calculations, t-score calculation, and threshold-based filtering. Subsequently,the side effect-related biological processes are found by merging the drug-biological process network and thedrug-side effect network. Evaluation is conducted in 2 ways: first, by discerning the number of biologicalprocesses discovered by our method that co-occur with Gene Ontology (GO) terms in relation to effectsextracted from PubMed records using a text-mining technique and second, determining whether there isimprovement in performance by limiting response processes by drugs sharing the same side effect tofrequent ones alone.
Results: The multi-level network (the process-drug-side effect network) was built by merging the drug-biologicalprocess network and the drug-side effect network. We generated a network of 74 drugs-168 side effects-2209biological process relation resources. The preliminary results showed that the process-drug-side effect network wasable to find meaningful relationships between biological processes and side effects in an efficient manner.
Conclusions: We propose a novel process-drug-side effect network for discovering the relationship betweenbiological processes and side effects. By exploring the relationship between drugs and phenotypes through amulti-level network, the mechanisms underlying the effect of specific drugs on the human body may beunderstood.
* Correspondence: 1Bio and Brain Engineering Department, KAIST, Daejeon 305-701, SouthKorea2Information Systems Department, New Jersey Institute of Technology,University Heights, Newark, USAFull list of author information is available at the end of the article 2011 Lee et al; licensee BioMed Central Ltd. This is an open access article distributed under the terms of the Creative CommonsAttribution License ), which permits unrestricted use, distribution, and reproduction inany medium, provided the original work is properly cited.
Lee et al. BMC Bioinformatics 2011, 12(Suppl 2):S2
gene expression responses to drugs [. SIDER is a
Side effects are unwanted responses to drug treatment,
recently developed database on side effects to document
and they are important resources of human phenotype
the relationship between drugs and side effects []. The
information. Drugs bind to target proteins and affect bio-
connectivity map provides drug-responsive gene expres-
logical processes, and the processes cause phenotype
sion information, and SIDER provides drug-side effect
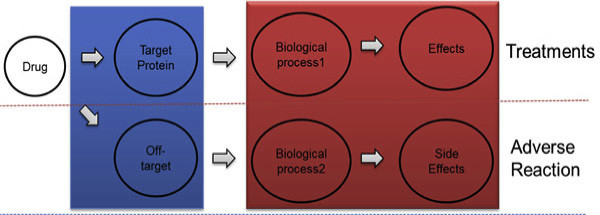
effect. However, drugs may also bind to off-target proteins,
which affects other biological processes and causes adverse
By utilizing the connectivity map and SIDER, we
reactions (Figure Side effects occur mainly when drugs
aimed to automatically discover the relationship between
bind to unintended off-targets. These side effects vary
biological processes and side effects by building a multi-
from simple symptoms, such as headache, to critical symp-
level network of drug-biological processes influenced by
toms, such as carcinoma. Most side effects are harmful to
the association of targets with side effects.
humans, but side effects can also be utilized to find new
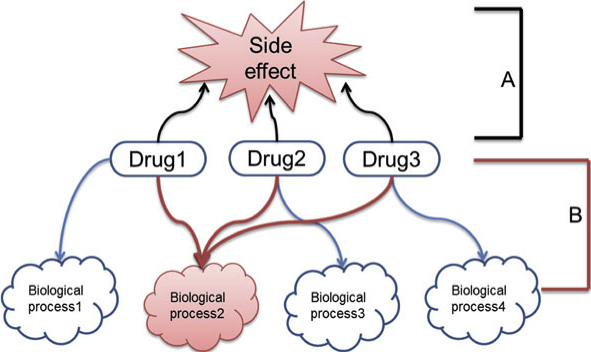
Figure is an example of our approach. If drug 1, 2,
uses for known drugs, such as Viagra. Therefore, it is
or 3 induces the same side effect, their common
highly desirable to automatically discover new targets for
response (biological process2) is potentially related to
known drugs and to understand the mechanisms that
their side effect. To examine these relationships, SIDER
cause side effects for target-specific treatments.
was used to construct the drug-side effect network
In their paper published in Science, Campellos et al
(Fig. SIDER provides information on the frequency
reported finding new targets based on drugs with similar
of connections between drugs and side effects. The
side effects [. They used an ABC network model built
drug-side effect relationships are filtered based on the
with (A) drugs developed for new targets, (B) targets,
frequency of relevant information to construct a reliable
and (C) side effects. Similarly, Keiser used chemical
drug-side effect network. The drug responsive biological
similarity to find new targets for a known drug [. Kei-
process network was also constructed using drug
ser's approach enabled the discovery of off-targets of a
responsive gene expression profiles (Fig.
known drug but did not consider the relationship
Gene ontology (GO) terms were used for biological
between a drug and its biological process.
processes, and gene set enrichment scores (ES) were
Like Keiser's and Campellos's studies, most previous
used to find which processes were upregulated or
research was focused mostly on finding off-target pro-
downregulated by the drugs. Subsequently, an ABC
teins causing the side effects. In addition, the biological
network model was built (A, processes; B, drugs; and
processes that are affected by the drug target need to be
C, side effects) to find relationships between side
considered because they cause phenotypical responses in
effects and biological processes (Fig. The results
the human biological system. A drug that influences
show that many processes found in the drug-process
biological processes can also have an impact on pheno-
network were meaningful and were confirmed by pre-
type. Therefore, if the biological process that responds
vious studies. In addition, a novel network consisting
to a drug influencing the phenotype is known then
of 168 effects and 2,209 biological processes was con-
drugs pertinent to the phenotype can be studied more
structed, and these relationships based on the ABC
effectively and systematically. To date, the relationships
model were also confirmed to be significant by support
between biological processes and side effects have not
from the literature. Finally, evaluations were conducted
been systematically researched.
in 2 ways: first, by quantifying how many biological
Two databases are available for studying relationships
between side effects and biological processes: the connec-tivity map and side effects resource (SIDER). The con-nectivity map is developed to generate and analyze adrug-gene-disease network from large-scale experimental
Figure 2 Concept of discovering side effect-related biologicalprocesses. A: Drug-Side effect network; B: Drug-Biological processes
Figure 1 Flow of drug treatments and adverse reaction.
Lee et al. BMC Bioinformatics 2011, 12(Suppl 2):S2
processes were found by our method and were concur-
Drug-biological process network construction
rently found in GO terms with effects extracted from
Figure illustrates an overview of the approach to con-
the PubMed records using a text-mining technique
structing the drug-process network. To find a drug-
and second, whether there was an improvement in per-
responsive biological process, gene rank information
formance by limiting response processes by drugs shar-
from the connectivity map and gene set information
ing the same side effect to frequent ones alone. The
available in GO were used. The ES for each GO term
experimental results showed that our process-drug-side
was calculated to find significant terms. Subsequently,
effect network was able to reveal meaningful relation-
the t-score was calculated to measure the significance of
ships between biological processes and side effects in
each process of the drug in question. Finally, a threshold
an efficient manner.
T was applied to remove insignificant data between
In addition to comprehensive evaluation, our method
drugs and biological processes.
contributes to systematically finding relationships
between drugs and biological processes using ES scores
A connectivity map was used to construct a drug-
calculations, t-score calculation, and threshold-based fil-
responsive process database. The connectivity map is a
tering. Second, side effect-related biological processes
collection of genome-wide transcriptional expression
are revealed by merging the drug-biological process net-
data from cultured human cells treated with bioactive
work and the drug-side effect network. Finally, data on
small molecules [The connectivity map contains
74 drugs, 168 effects, and 2209 biological process rela-
6,100 expression profiles representing 1,309 compounds.
tion resources were generated.
The connectivity map provided rank information ofprobes for each sample. There were 22,283 probes and
Datasets and methods
6,100 samples in the rank matrix. Probe sets were
To discover the relationships between side effects and bio-
ranked in descending order of d, where d is the ratio of
logical processes, 2 networks were constructed: the drug-
the corresponding treatment-to-control values. There-
biological process network and the drug-side effect net-
fore, "top rank" means probes that are more highly
work. Side effect and biological process relationships were
upregulated than the control; "bottom rank" means
automatically revealed by connecting the 2 networks.
probes that are more highly downregulated than the
Figure 3 Schematic diagram for inferring relationships between biological processes (GO) and drugs.
Lee et al. BMC Bioinformatics 2011, 12(Suppl 2):S2
control. Top rank genes are positively affected by drugs,
The ES for gene set i was calculated as follows:
and bottom rank genes are negatively affected by drugs.
Gene Ontology
GO was used as a resource for biological processes. The
GO project provided term definitions representing geneproduct properties in 3 categories cellular compo-
ES is the maximum deviation from zero of Sumij. For
nent, molecular function, and biological processes
a randomly distributed gene set, Si, ESi will be relatively
Gene Set Enrichment Analysis
small, but if it is concentrated at the top or the bottom
Gene Set Enrichment Analysis (GSEA) was used to
of the list, or otherwise non-randomly distributed, then
show the relationship of processes to drugs. GSEA is a
ESi will be correspondingly high.
gene expression profile analysis technique used for find-
Process significance calculation
ing the significance of a function, pathway, or GO cate-
A t-score was used to show the significance of each pro-
gory It calculates an ES that reflects the degree to
cess. To get a normalized t-score robust to outliers, the
which set S is over-represented at the extremes (top or
ESs were standardized with the median-MAD normali-
bottom) of the entire ranked list L. The score is calcu-
zation method for each process ESij was used to
lated by walking down the L, increasing a running-sum
denote an ES of process i = {1,2,…p} from sample j =
statistic when a gene in S is encountered, and decreas-
ing it when a gene not in S is encountered. ES is themaximum deviation from zero encountered in the ran-
In this approach, gene sets S i = {1,…,n} are defined by
GO terms and ranking information of each gene L j =
Both MEDi and MADi were used to represent the
{1,…,k} from the connectivity map. The ESs of each
median, and the median absolute deviation of enrich-
gene set were calculated in 6,100 samples. ESs of upre-
ment scores for biological process i. The scale factor of
gulated processes were calculated based on the ranked
1.4826 in the above equation was used to make MADi
list; ESs of downregulated processes were calculated
an estimator of s.
using the reversed ranked list.
Drug-side effect network construction
Side effect resource (SIDER)
if g is in geneset S
SIDER was developed to discover the relationships
between side effects and drugs, and SIDER connects 888
not in geneset S
drugs to 1,450 types of side effects It contains fre-
quency of occurrence information between drugs and sideeffects for one-third of the drug-side effect pairs. (Table Drug-side effect network construction
Cij is defined as a summing factor of a gene gj that is
Drug-side effect relationships available in SIDER are
drawn from L. N is the number of total genes in L, and
incomplete because side effects do not occur in gene
Ns is the number of genes in the gene set Si.
expression data every time. Therefore, drug-side effect
Then the running sum Sumij for each sample against
relationships appearing in SIDER needed to be filtered
gene j is calculated using the following equation:
to find highly occurring relationships of gene expression
data. Among the 120,598 drug-side effect relationships
in SIDER, however, only 15,672 relations have a fre-
⎨ S +C for j = 2,.,k
quency higher than 5%. Most relations had no informa-tion about frequency. Twenty percent was set as a
Table 1 Examples of SIDER information
Description of frequency
A search tool for Interactions of chemicals (STITCH) ID is represented as a compound ID in STITCH databases. A unified medical language system (UMLS) conceptID implies a description of frequency that consists of 4 types: postmarketing, rare, infrequent, and frequent. For frequent cases, a percentage is used instead ofthe word "frequent."
Lee et al. BMC Bioinformatics 2011, 12(Suppl 2):S2
threshold of frequency to find drug-side effect relation-
normalized drug information for 1,494 FDA-approved
ships (Additional file Finally, 6,197 filtered relations
drugs. The file "drugcards.zip" was downloaded from
were used to construct the drug-side effect network.
the DrugBank Three fields, i.e., drug ID, synonym,and brand names, were used to normalize drug names
Biological process-side effect network construction
between the AB network and the BC network. Because
Lastly, the biological process-side effect network was
of the small number of side effects with frequency infor-
built. Figure shows the method used for finding rela-
mation, only 74 drugs were included in both the AB
tionships between side effects and biological processes.
and BC networks. Finally, using the 74 drugs with 168
The hypothesis used was that frequent responses to
effects and 2,209 processes network, data on 63,878
drugs causing the same side effect have higher probabil-
relationships were generated.
ities of correlation with a side effect than less frequent
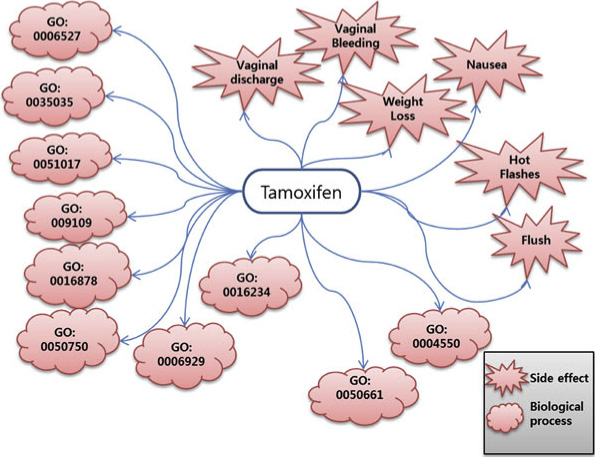
To illustrate the construction of the side effect-biologi-
cal process network, the example of tamoxifen was used.
Connecting drug-process and drug-side effect networks
Tamoxifen is one of drugs present in both the drug-pro-
To find relationships between biological processes and
cess network and the drug-side effect network, and it is
side effects, drug information was used as a bridge
used as a mediator to connect the 2 networks (Figure
between the 2 networks, the drug-biological process net-
Discovering side effect-related processes from the drug-
work and the drug-side effect network. This can be
process-side effect network
represented as an ABC model consisting of A, biological
Co-occurrence-based scoring was used to determine
processes; B, drugs; and C, side-effects. To merge the 2
how many drugs shared the same side effect in each
networks, the drug names needed to be normalized
process. A biological process that has a high co-occur-
because the connectivity map and SIDER use different
rence score implies that the process is closely related to
drug identification. DrugBank was used to obtain
Figure 4 Schematic diagram for discovering side effect-biological process relationships. Nausea, which is the sensation of unease anddiscomfort in the stomach with an urge to vomit, is an example of a side effect. In this example, 3 of 5 drugs known to cause nausea arerelated to anti-oxidant activity, but the other processes were perturbed by only 1 or 2 drugs. Based on this connectivity, the scores werecalculated to find possible processes causing the side effects. Finally, the processes were analyzed to ensure whether the side effect-biologicalprocess relationships revealed by this approach were meaningful.
Lee et al. BMC Bioinformatics 2011, 12(Suppl 2):S2
Figure 5 Tamoxifen-mediated drug-process network and drug-side effect network. Tamoxifen causes six types of side effects that arereported with a frequency of greater than 20%. We found 10 significant upregulated biological processes associated with tamoxifen (p < 0.001).
the targeted side effect; therefore, side effect data are
Evaluation method
only used when at least 2 drugs are related.
The constructed network was evaluated by examining
Scoreij was used to denote the co-occurrence score of
the significance of relationships between biological pro-
a process i = {1,2,…n} in a side effect j = {1,2,…,n}. For
cesses and side effects provided by the network. The sig-
each side effect i = {1,2,.n}, CDij is used to represent the
nificance of relationships was measured by comparing
number of drugs that have the co-occurring process i
biological processes represented by GO terms with the
related to a side effect j, and TDj is used to represent
co-occurrence of GO terms and effect names appearing
the number of total drugs related to the side effect j.
in PubMed records. The first and second steps wereused to calculate the co-occurrence of effect names and
GO terms. First, a set of PubMed records with an effect
name was used as a query. The "[abstract/title]" qualifier
was used in the PubMed search to ensure that effect
In the drug-process-side effect network, nausea is the
names appeared in abstracts or titles. Secondly, because
most common side effect and is connected to 26 drugs.
it is not easy to extract noun phrases from GO terms by
To investigate how many drugs with the same processes
using a simple exact string match, significant phrases
were significant, drug-side effect relations were randomly
were used. To this end, the following text-mining tech-
generated. The processes were determined by randomly
niques were used: a conditional random field (CRF)-
selecting 74 drugs (2 26) for each side effect, repeated
based sentence segmentation technique was used to
1,000 times. The distribution was then determined usingthe number of related drugs on processes, and the pro-cesses with a p-value less than 0.05 were analyzed.
Table 2 Side effect-related process threshold
Table shows the total number of drugs causing side
Number of total drugs causing side
effects and how many co-occurring drugs are significant
in the total number of drugs. In the case of total drugs
ranging from 2 to 5, co-significant processes in more
than 2 drugs are significant to side effects.
Lee et al. BMC Bioinformatics 2011, 12(Suppl 2):S2
parse abstracts , the sentence was tokenized with the
Tamoxifen is an antagonist of estrogen receptors in breast
part-of-speech (POS) technique using an extension of
tissue Some breast cancers require estrogen to grow.
the Brill POS tagger [, and noun phrase groups were
Estrogen binds to and activates the estrogen receptors in
extracted with a text chunking technique that spe-
these cells. Tamoxifen is metabolized into compounds
cialized in biomedical data collections. Thirdly, the
that bind to estrogen receptors but do not activate them.
extracted noun phrases were compared with GO terms,
As a result, tamoxifen prevents estrogen from binding to
and the number of matched phrases was stored along
receptors, and breast cancer cell growth is blocked.
with the phrases. The comparison between extracted
Table shows significant processes related to tamoxi-
phrases and GO terms was based on string similarity
fen in MCF7 cells (breast cancer cell line) using our
between the 2, and the shortest path-based edit distance
method. The most significant GO term is nucleoside
(SPED) technique was used. The SPED technique is
diphosphate kinase activity, and Neeman's experiments
a variation of Markov random field-based edit distance
support that nucleoside diphosphate is higher in the
(MRFED) and calculates the shortest path between 2
tamoxifen-treated cells ]. Tamoxifen also upregulates
selected vertices of a graph. Various thresholds were
low-density lipoprotein receptor binding according to
tested for string similarities, and the threshold was set
Suarez's study These results show that biological
at 0.55 since it gave the best performance. Table
processes in our drug-biological upregulated process
shows the number of abstracts found in PubMed and
relationships are meaningful in drug response profiles.
the total GO terms evaluated for rash and urinary tract
Table shows that there are 6 downregulated pro-
infection (UTI); 2,209 GO terms were utilized to calcu-
cesses for tamoxifen. Translation elongation factor activ-
late co-occurrence scores for evaluation.
ity is highly related to tamoxifen in MCF-7 cells. Asreported by Byun , translational elongation factor
Results and discussion
are underwent by tamoxifen. Cilium is known as cellular
The goodness of the discovered relations was confirmed
GPS, and is crucial to wound repair. For cilium, the per-
using a survey of literature. First, the drug-biological
ipheral loss of cilia function is reported in tamoxifen
process network was analyzed using the tamoxifen case
treats cell Tamoxifen reduced proteoglycan synth-
study to show the significance of our method. Secondly,
esis in an in vivo study [Finally, Lahoute found that
the ABC network model for A, processes; B, drugs; and
tamoxifen induced a loss of serum response factor
C, side-effects was analyzed to find relationships
(SRF), which induces downregulation of skeletal muscle
between side effects and biological processes. Two case
fiber development These results confirm that biolo-
studies are used as examples to show the meaningful-
gical processes in the drug-biological downregulated
ness of the network. Finally, the performance of the net-
processes relationships are also meaningful in drug
work was evaluated by comparing the number of
response profiles.
matched GO terms extracted by a text-mining methodthat was applied to a large number of PubMed abstracts.
Biological process-side effect networkThe biological process-side effect network contains
Drug-biological process network
63,878 biological process-side effect pairs and covers a
The network connects 1,309 drugs to 3,629 GO terms
total of 168 side effects and 2,209 processes. In this net-
with its ES. The GO terms are varied and some GO
work, there are 37,280 upregulated biological process-
terms are too broad to interpret the relations; therefore,
side effect pairs with a total of 168 side effects and
GO terms with less than 31 genes in human were chosen.
Highly relevant GO terms with a t-score greater than 3.0
Table 4 Upregulated tamoxifen-related processes in the
(approximately p = 0.001) were also chosen. A positive
drug-process network
association is more upregulated than the control; a nega-
tive association is more downregulated than the control.
nucleoside diphosphate kinase activity
Case study—Tamoxifen-related biological processes in the
NADP or NADPH binding
constructed networkFor the case study of the drug-process network, tamoxifen
was chosen because of its well-known mechanism.
substrate-bound cell migration
low-density lipoprotein receptor binding
acid-thiol ligase activity
Table 3 Datasets for evaluation
coenzyme catabolic process
Urinary tract infection
actin filament bundle formation
histone acetyltransferase binding
arginine catabolic process
Lee et al. BMC Bioinformatics 2011, 12(Suppl 2):S2
Table 5 Down regulated tamoxifen-related processes in
Case study—Nausea-related biological processes in the
the drug-process network
biological processes-side effect network
In the case study of nausea, the most common cause is
Translation elongation factor activity
gastroenteritis or food poisoning, but nausea also fre-
quently occurs as a medication side effect. Nausea is
Hexose biosynthetic process
connected to 26 drugs in the drug-side effect network.
Proteoglycan biosynthetic process
For random sampling analysis, a score greater than or
equal to 0.15 was considered significant (p < 0.05).
Skeletal muscle fiber development
Table shows 3 upregulated processes related to nau-
sea. For example, Yoneyama et al found that adenosinedeaminase activity (ADA) was related to hyperemesis
1,736 processes (Additional file . Furthermore, there
gravidarum (vomiting and nausea) [Chemothera-
are 26,598 downregulated biological process-side effect
peutic agents induce oxidative damage in the gastroin-
pairs, 168 side effects, and 1,430 processes (Additional
testinal tract, causing nausea and vomiting; therefore,
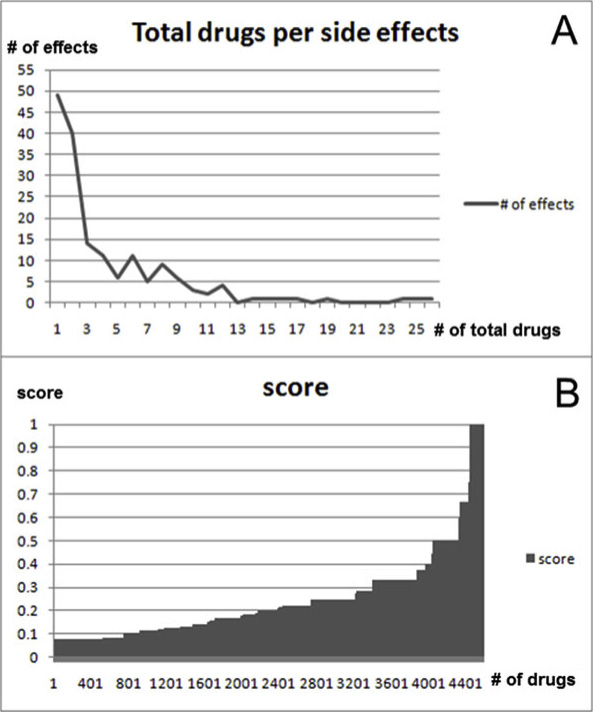
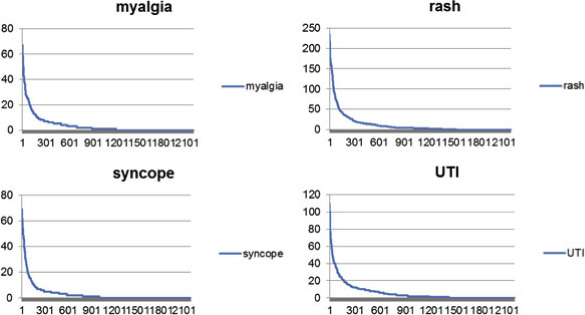
file Figure shows the statistics of upregulated
upregulated antioxidant activity is needed to reduce oxi-
processes. To apply our algorithm, the side effects of
dative damages [. Also, nausea occurs when blood
more than 1 drug need to be considered. We finally
sugar rises rapidly [and the cellular carbohydrate
used 119 effects and 744 processes with 4581 relations.
catabolic process is noted for increasing the blood sugar
level in the body.
Table shows downregulated processes that are
related to nausea. In human studies, treatment withcytokines is often accompanied by nausea Synap-tic vesicle endocytosis may subsequently be used forneurotransmitter storage Neurotransmitters arealso involved in relaying messages of nausea andvomiting Case study—Anemia-related biological processes in thebiological processes-side effect networkAnemia is defined as a qualitative or quantitative defi-ciency of hemoglobin, which is a molecular substanceinside red blood cells. As hemoglobin carries oxygenfrom the lungs to the tissues, anemia leads to hypoxia inorgans. Anemia is connected to 10 drugs in the drug-side effect network. A random sampling analysis scoregreater than or equal to 0.3 was considered significant(p < 0.05).
Table shows anemia-related upregulated processes.
Cytochrome b5 reductase is an enzyme in the blood. Itcontrols the amount of iron in red blood cells and helpsthe cells carry oxygen. Therefore, cytochrome b5 reduc-tase is highly related to anemia. Antioxidant activity ofblood serum is highly related to anemia Anemiasearch results are similar to those of nausea(GO:0016209, GO:0044275) because 8 of 10 drugs caus-
Figure 6 Network statistics in drug upregulated biological
ing anemia also cause nausea.
process-side effect network. Figure 6A shows the relationshipbetween side effects and the total number of connected drugs inupregulated processes. The range of the total number of drugs is 1to 26. It shows that 49 side effects occurred with only 1 drug, and
Table 6 Nausea-related upregulated processes
26 drugs caused nausea. Figure 6B shows that most scores of
relations (about 88%) are less than 0.5. Half of relation scores are
less than 0.2. Further, only 543 relation scores are greater than orequal to 0.5. This means that many significant processes are not
Deaminase activity
over-represented among drugs. Therefore, a threshold needs to be
Antioxidant activity
determined to show which processes are highly related to which
Cellular carbohydrate catabolic
side effect (Table
Lee et al. BMC Bioinformatics 2011, 12(Suppl 2):S2
Table 7 Nausea-related downregulated processes
Table 9 Anemia related down-regulated processes
Regulation of cytokine production
during immune response
Regulation of cytokine production
Alpha-beta T-cell activation
during immune response
Synaptic vesicle endocytosis
Intramolecular oxidoreductase activity
Synaptic vesicle endocytosis
mining results, 35 were found in the top 40% of theresults, and 45 processes were in the top 50% of the
Table shows downregulated processes related to
anemia. Regulation of cytokine production during
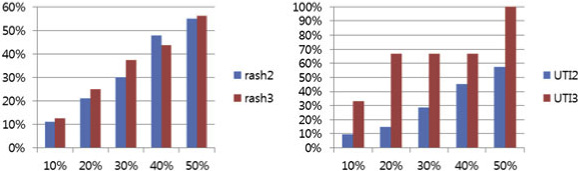
It was assumed that more frequent responsive pro-
immune response was related to anemia in a previous
cesses to drugs causing the same side effect have higher
study [Iron deficiency induces anemia and neuro-
probabilities of correlation with a side effect than less
transmitter deficiency. Synaptic vesicle endocytosis may
frequent responsive processes. The hypothesis was
subsequently be used for neurotransmitter storage
tested with rash and UTI cases. In Figure , the rash2
Downregulated activity of synaptic vesicle endocytosis
bar (blue) includes less frequent response processes, and
induces neurotransmitter deficiency.
the rash3 bar (red) includes only significant frequentresponse processes. For the rash2 bar, we found 100
Evaluation result
related processes. Eleven processes (11%) were found in
Two different side effects, i.e., rash, and UTI, were
the top 10% of the text-mining results, 21 (21%) were in
used for evaluation by retrieving PubMed records for
the top 20% of the results, 30 (30%) were in the top
each side effect and calculating the co-occurrence
30% of the results, 48 (48%) were in the top 40% of the
scores for each GO term. Figure shows the co-occur-
results, and 55 processes (55%) were in the top 50% of
rence scores for each GO term for 2 cases. To evaluate
the results. The rash3 bar shows 16 significant frequent
the significance of discovered biological processes, the
response processes by drugs. Two processes (13%) were
top 10%, 20%, 30%, 40%, and 50% scores in the distri-
in the top 10%, 4 (25%) were in the top 20%, 6 (38%)
bution were selected, as shown in Figure This
were in the top 30%, 7 (44%) were in the top 40%, and
threshold was used to examine the significance of the
9 processes (56%) were in the top 50%. For all results,
processes in each top n%.
except 40%, rash3 performs better than rash2 in terms
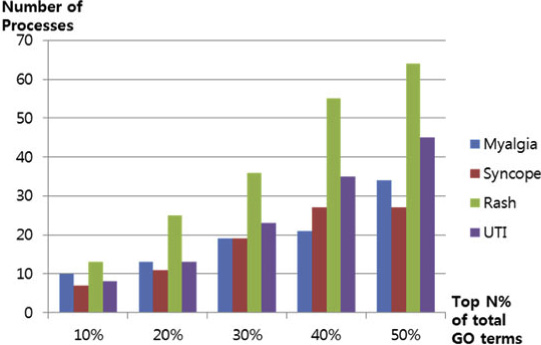
Figure shows the number of matched terms between
of the proportion of processes discovered over the top n
our approach and the results of the text-mining method
ranked processed (Fig.
for GO terms extracted from PubMed.
In Figure the UTI2 bar (blue) includes less fre-
For rash, our method showed 116 GO-related terms.
quent response processes, and the UTI3 bar (red) only
Of 116 processes, 13 were found in the top 10% of the
includes significant frequent response processes. For the
text-mining results, 25 processes were found in the top
UTI2 bar, our method found 73 related processes. Seven
20% of the results, 36 processes were found in the
processes (10%) were found in the top 10%, 11 (15%)
top 30% of the results, 55 processes were found in the
were found in the top 20% of the results, 21 (29%) were
top 40% of the results, and 64 processes were in the top
found in the top 30%, 33 (45%) were found in the top
50% of the results. For UTI, our method shows 76
40%, and 42 processes (58%) were found in the top 50%.
GO-related terms. Of 76 processes, 8 were found in the
As indicated by the UTI3 bar, our method found 3 fre-
top 10% of the results, 13 were found in the top 20% of
quent response processes by drugs. One process (33%)
the results, 23 were found in the top 30% of the text-
was found in the top 10%, 2 processes (67%) in the top20%, 30%, and 40%, and 3 processes (100%) in the top50% of the results. This shows that UTI3 performed bet-
Table 8 Anemia related up-regulated processes
ter than UTI2 in all 5 cases (Fig. and confirms that
our method was able to find relationships between bio-logical processes and side effects.
Antioxidant activity
Eukaryotic translation initiationfactor 3 complex
Cytochrome-b5 reductase activity
In this paper, we proposed a new approach for automa-
Cellular carbohydrate catabolic
tically discovering relationships between biological pro-
cesses and side effects using the co-occurrence based
Lee et al. BMC Bioinformatics 2011, 12(Suppl 2):S2
Figure 7 Literature-based co-occurrence score distribution of 2 side effects. Top 20 processes are omitted in this graph because of rangeproblem.
multi-level network. We built the drug-biological pro-cess network, and showed that our method can be usedto discover drug related significant processes (as shownin the example of tamoxifen). In addition, we built anABC Model (using A, biological processes; B, drugs; andC, side effect information) for 74 drugs, 168 side effects,and 2,209 biological processes. A literature analysis con-firmed that relations between side effects and biologicalprocesses found by co-occurrence were meaningful. Inaddition, our method was evaluated using a text-miningtechnique to extract co-occurring GO terms with effects.
The results showed that our method is efficient and use-ful for finding relationships between biological processesand side effects.
Figure 8 The number of processes matched with text-mining
In a future study, the scoring scheme will be improved
results for rash, and UTI. The x axis is the top n% of co-occurred
because the current scoring algorithm considers all
GO terms with biological processes (total 2,209). The y axis is the
drugs equally regardless of the number of side effects or
number of processes with scores greater than the top n% (x axis)
the number of biological processes associated with
threshold of the total process scores.
them. For example, drug A has only 1 side effect (s-1),
Figure 9 Evaluation of our hypothesis for rash and UTI. The x axis is the top n% for the total process scores. The y axis is percentage ofprocesses with scores greater than the top n% (x axis) threshold of the total processes scores.
Lee et al. BMC Bioinformatics 2011, 12(Suppl 2):S2
whereas drug B has 2 side effects (s1 and s2), with all
Authors' contributions
other settings the same, including association with bio-
LS designed the method and drafted the manuscript along with MS. MSalso critically revised the manuscript for important intellectual content. KHL
logical process (p). In this case, drug A provides more
and DL supervised the work and gave final approval of the version of the
reliable information on the association of s1and p than
manuscript to be submitted.
drug B. However, the proposed scoring scheme cannot
Competing interests
reflect this, thus causing a loss of information for a
The authors declare that they have no competing interests.
more accurate association. We also plan to investigatewhether biological processes related to side effects are
Published: 29 March 2011
valuable resources in elucidating the mechanism of drug
effects. Instead of using the text-mining technique, a
Campillos M, Kuhn M, Gavin AC, Jensen LJ, Bork P:
manual evaluation will be conducted to identify undis-
In Science. Volume 321. New York,
covered relationships from process-side effect pairs that
Keiser MJ, Setola V, Irwin JJ, Laggner C, Abbas AI, Hufeisen SJ, Jensen NH,
are not mentioned in literature. In addition, we are
Kuijer MB, Matos RC, Tran TB, et al:
interested in a research on personalized drug responsive
Nature 2009, 462(7270):175-181.
expression data by applying multi-level networks for
Lamb J, Crawford ED, Peck D, Modell JW, Blat IC, Wrobel MJ, Lerner J,Brunet JP, Subramanian A, Ross KN, et al:
personalized medicine. By exploring the relationship
between drugs and phenotypes on the multi-level net-
In Science. Volume 313. New York, NY; 2006:(5795):1929-1935.
work, we will be able to understand the mechanisms
Kuhn M, Campillos M, Letunic I, Jensen LJ, Bork P: Molecular systems biology 6:343.
underlying drug involvement in the human body.
Ashburner M, Ball CA, Blake JA, Botstein D, Butler H, Cherry JM, Davis AP,Dolinski K, Dwight SS, Eppig JT, et al: Nature genetics
Additional material
2000, 25(1):25-29.
Subramanian A, Tamayo P, Mootha VK, Mukherjee S, Ebert BL, Gillette MA,
file contains drug names and related side
Paulovich A, Pomeroy SL, Golub TR, Lander ES, et al:
effect names which are reported with frequency of greater than
20% from SIDER. First Column: Drug Bank ID Second Column: Drug
Proceedings of the National Academy of Sciences of the
name Third Column: Effect ID ( UMLS Concept ID) Fourth Column:
United States of America 2005, 102(43):15545-15550.
Effect name.
Wu Biostatistics2007, 8(3):566-575.
file contains up_regulated processes (T-score
Wishart DS, Knox C, Guo AC, Cheng D, Shrivastava S, Tzur D, Gautam B,
> 3.0) and related effects. First Column: Effect ID ( UMLS Concept
Hassanali M: DrugBank: a knowledgebase for drugs, drug actions and
ID) Second Column: Process ID ( Gene Ontology ID) Third Column:
drug targets. Nucleic Acids Res 2008, 34:D901-6.
The number of drugs which affect to process and causing the side
Lafferty J, McCallum A, Pereira F: Condition random fields: probabilistic
effect. Fourth Column: Total drugs which are causing the side
models for segmenting and labeling sequence data. Proc. 18th
International conf. on Machine Learning 282-289.
file contains down_regulated processes (T-
Brill E: A simple rule-based part of speech tagger. HLT'91 Proceeding of the
score > 3.0) and related effects. First Column: Effect ID ( UMLS
workshop on speech and Natural Language 1992, 112-116.
Concept ID) Second Column: Process ID ( Gene Ontology ID) Third
Phan X: CRFChunker: CRF English Phrase Chunker. 2006
Column: The number of drugs which affect to process and causing
the side effect. Fourth Column: Total drugs which are causing the
Rudniy A, Song M, Geller
side effect.
International Journal of Data Mining and Bioinformatics2010.
Hodges LC, Cook JD, Lobenhofer EK, Li L, Bennett L, Bushel PR, Aldaz CM,Afshari CA, Walker CL: Mol Cancer
Res 2003, 1(4):300-311.
This work was supported by the Korean Systems Biology Research Project
Neeman M, Degani H:
(20100002164), the World Class University program (R32-2008-000-10218-0)
and the Basic Research Laboratory grant (2009-0086964) of the Ministry of
Cancer research 1989, 49(3):589-594.
Education, Science and Technology through the National Research
Suarez Y, Fernandez C, Gomez-Coronado D, Ferruelo AJ, Davalos A,
Foundation of Korea. It was also supported by the Korea Institute of Science
Martinez-Botas J, Lasuncion MA:
and Technology Information (KISTI).
This article has been published as part of BMC Bioinformatics Volume 12
research 2004, 64(2):346-355.
Supplement 2, 2011: Fourth International Workshop on Data and Text
Byun HO, Han NK, Lee HJ, Kim KB, Ko YG, Yoon G, Lee YS, Hong SI, Lee JS:
Mining in Bioinformatics (DTMBio) 2010. The full contents of the supplement
are available online at
Cancer research 2009, 69(11):4638-4647.
Kesterson RA, Berbari NF, Pasek RC, Yoder BK: Methods in cell
biology 2009, 94:163-179.
1Bio and Brain Engineering Department, KAIST, Daejeon 305-701, South
Rosner IA, Malemud CJ, Hassid AI, Goldberg VM, Boja BA, Moskowitz RW:
Korea. 2Information Systems Department, New Jersey Institute of
Technology, University Heights, Newark, USA.
Prostaglandins 1983, 26(1):123-138.
Lee et al. BMC Bioinformatics 2011, 12(Suppl 2):S2
Lahoute C, Sotiropoulos A, Favier M, Guillet-Deniau I, Charvet C, Ferry A,Butler-Browne G, Metzger D, Tuil D, Daegelen D: PloS one 2008, 3(12):e3910.
Yoneyama Y, Sawa R, Suzuki S, Otsubo Y, Araki Clinicachimica acta; international journal of clinical chemistry 2002, 324(1-2):141-145.
Wang CZ, Fishbein A, Aung HH, Mehendale SR, Chang WT, Xie JT, Li J,Yuan CS: Polyphenol contents in grape-seed extracts correlate withantipica effects in cisplatin-treated rats. In Journal of alternative andcomplementary medicine. Volume 11. New York, NY; 2005:(6):1059-1065.
Ezrin C, Salter JM, Ogryzlo MA, Best CH: The Clinical and Metabolic Effectsof Glucagon. Can Med Assoc J 1957, 78(2):3.
Kronfol Z, Remick The American journal of psychiatry 2000, 157(5):683-694.
Hesketh PJ: The NewEngland journal of medicine 2008, 358(23):2482-2494.
Levina AA, Andreeva AP, Tsvetaeva NV, Tsibul'skaia MM, Minaeva LM,Tokarev Iu N: Gematologiia i transfuziologiia 1991,36(7):11-14.
Morceau F, Dicato M, Diederich M: Mediators ofinflammation 2009, 2009:405016.
doi:10.1186/1471-2105-12-S2-S2Cite this article as: Lee et al.: Building the process-drug–side effectnetwork to discover the relationship between biological Processes andside effects. BMC Bioinformatics 2011 12(Suppl 2):S2.
Submit your next manuscript to BioMed Central
and take full advantage of:
• Convenient online submission
• Thorough peer review
• No space constraints or color figure charges
• Immediate publication on acceptance
• Inclusion in PubMed, CAS, Scopus and Google Scholar
• Research which is freely available for redistribution
Submit your manuscript at www.biomedcentral.com/submit
Source: http://biosoft.kaist.ac.kr/~dhlee/pubs/papers/2011BuildingProcessDrug.pdf
the 27th annual convention of the iacr – a report
The 27th Annual Convention of the IACR – A Report by Dr. Ujjwala M. WarawdekarGenetic Engineering Dept.ACTREC, Tata Memorial Centre,Navi Mumbai. The 27th Annual Convention of the IACR named IACRCON –2008 was held at the GCRI, Ahmedabad between the 7th and 9th February, 2008. It coincided with the celebrations of the silver jubilee of the Department of Cancer Biology of the GCRI and the birth centenary year of Dr. T B Patel, the Founder Director whose guidance and efforts have helped establish the Institute to its present stature. The Convention was spaced out between the first and the third day with a total of eight sessions covering various areas of Cancer research, basic and translational, with a global representation. The International Symposium on Frontiers in Functional Genomics between these two days was the high point of the Convention and featured talks on approaches and clinical trials applying latest technologies, to study, understand and treat Cancer.
Microsoft word - ul lafayette h1n1 prep _2_.docx
UL Lafayette GENERAL PANDEMIC GUIDE Seasonal (common) Flu • Caused by: Human influenza virus • Transmitted: From person to person • Immunity: o Most people have some immunity o Vaccine is available Pandemic flu would describe a new human virus that: • Is easily spread throughout the world