Untitled
Proceedings of 2014 Zone 1 Conference of the American Society for Engineering Education (ASEE Zone 1) MR Image Assisted Drug Delivery in Respiratory Tract and Trachea Tissues Based on an Enhanced Level Set Method Mohhammad Daneshzand, Reza A. Zoroofi, and Miad Faezipour, Member, IEEE capacitance vessels of nasal mucosa [1]. Antigen challenge Abstract— In medical diagnosis and therapy, finding an can be moderated by some drugs such as histamines andappropriate method to evaluate the effect of various drugs is arachidonic acid metabolites. Histamines and antigens effect
crucial. There are several ways to qualify a drug for a specific
on nasal mucosa has been evaluated by some previous disease and one way is through medical image analysis. This methods [2]. A new method for drug evaluation on various
process varies with the tissues we want to analyze and the tissues is through image analysis and numerous works have
imaging technique that is employed. For hydrous tissues such as
developed this method [3],[4],[5]. nasal and trachea, Magnetic Resonance Imaging can be helpful
Image guided drug delivery is a concept in which the for further evaluations. Trachea can be challenged by an antigen
specific effect of a drug is evaluated through medical images. which will increase both nasal vascular permeability and The imaging techniques are consisted of MRI, CT, PET and
intranasal pressure. Another effect of antigen challenge into Ultrasound [6], [7]. Another issue in medical image analysis
nasal cavity which may cause nasal blockage, is swelling of nasal
for drug evaluation is how to process the image in order to achieve the maximum similarity to manual segmentations of mucosa and a decrease in nasopharyngeal airway. In this paper,
doctors. Hence, finding an optimum method for processing is we study the effect of an antihistamine drug on swelling of a critical task. We suggest that our enhanced image processing
mucosa. This antihistamine is called Azelastine and is injected to
technique should be applied for the tissue we want to analyze guinea pig to evaluate the swelling changes of nasal and trachea
[8], [9], and [10]. In this article, we combine some mucosa. After 20 minutes of injection, a MR image of the segmentation algorithms, offering a new way to maximize the
motionless animal is taken and this imaging will continue for 30,
efficiency of drug evaluation which can also be compared to 40, 50 and 60 minutes from injection. Due to the ambiguous the physician's results of drug evaluation [11], [12], [13].
nature of respiratory tract, finding a precise method for
The paper is organized as follows. In section II, we discuss processing has useful results. Watershed algorithm has two image processing techniques. In section III, a fusion of
widespread function in medical images but its defects in these methods is presented for evaluation of MR images of
segmentation can be modified by different methods. An enhanced
nasopharyngeal. We also define a modified active contours level set method is used here; a nonparametric active contour for
algorithm to detect trachea. We implement our proposed nasal and trachea detection. This automatic image segmentation
method on MR images of guinea pig to evaluate the effect of and tissue detection can help physicians evaluate the effect of a
the Azelastine drug in the same section. The results of this specific drug from medical images.
method is compared with manual processing and previous works. Section IV is devoted to defining a 3D model of Keywords— Nasal and Trachea, Magnetic Resonance Imaging, trachea and trachea airways in order to have a better
Azelastine, Watershed Algorithm, Level Set Method.
comprehension of the effect of our desired drug. Finally, in section V, we discuss the whole idea of our method on image guided drug delivery issues and some viewpoints for future works are presented. One of the most important symptoms of allergic rhinitis is nasal blockage. Nasal blockage happens when the nasal mucosa starts to swell and this is a reaction to antigens. The II. RELATED WORK antigen challenge will increase vascular permeability dilate the A. Watershed Algorithm The watershed idea has been introduced in 1979 by S. M. Daneshzand is with the Department of Computer Science & Beucher and C. Lantuéjoul and its concept in image Engineering, University of Bridgeport, CT, 06604, USA (e-mail: [email protected]). processing deals with how a drop of water falls through R. A Zoroofi is with the School of Electrical and Computer Engineering, topographic relief until it finally reaches to a minimum. When University of Tehran, Tehran, Iran. (e-mail: [email protected]). water fills local minimum, many regions will appear and by M. Faezipour (corresponding author) is with the Departments of Computer increasing water, these regions may merge which at this point, Science & Engineering and Biomedical Engineering, University of Bridgeport, CT, 06604, USA (phone: 203-576-4702; fax: 203-576-4765; e- some dam can prevent this merging. These dams are mail: [email protected]). 978-1-4799-5233-5/14/$31.00 2014 IEEE watershed lines [14], [15]. The main procedure of watershed Where H(f) is a Heaviside function [20]. Consequently the algorithm first happens with a selection of a point, then variable level set function f should satisfy Equation 6. neighboring pixels of this point are inserted into a priority c + c query with a priority level corresponding to the gray level of v f the pixel. The pixel which has the highest gray value will be c + c selected and labeled with its neighbors that have the same max( I(x) − label. This will continue until all pixels get into priority query In this equation, the first term is a Signed Pressure Force (SPF) and is constructed based on the above equations [20]. This term can control the direction of contours so they can B. Level Set Method shrink outside and expand inside of a desired object in image I. Also, v represents the speed of contours. The enhanced level The level set method which was presented by Osher and set method is a combination of watershed algorithm as a Sethian in 1987, is a simple method for computing and preprocessing step and the new level set method which is analyzing the motion of the interface in two or three summarized as follows: dimensions. Level sets are used to implement force curves. These curves are represented as Equation 1. If a curve C moves in a normal direction with speed v, the level set • Implement a watershed transform on image function F will satisfy Equation 2 [18], [19]. • Regionally segment image with Watershed algorithm and highlight the specific segmented parts C={(x, y) f(x, y) =0} according to Equations 4 and 5 • Extract the level set function in 6 ∂ =∇ f • If f>0, then f=1, else f=-1 and a local segmentation will One of the most important problems of level set is that it needs to be re-initialized which may cause the side effect of In our MR set of images, there are some slices containing moving the zero level set away from its interface. In addition, nasal respiratory tract parts. Due to complexity of these parts, the re-initialization step is a highly costly and very time we applied an active contours method based on local energy consuming operation. A new way to solve this problem is fitting [23]. Therefore, we define an energy function as presented in [20] that uses a Gaussian filter to make the level set function regular. E LIF (φ) = ∫ Ω (X ) [F] − I (X ) dx III. PROPOSED METHOD Our method here uses a preprocessing step in order to signify the boundaries of the image. This step is consisted of a where I(x) and represent our image and our modified distance transform on the image for using watershed algorithm image with a Gaussian window, respectively. Then, we used a which will segment and highlight the boundaries of the level set function with a modified Dirac functionδε (φ ): processed image. After this step, a level set method can be implemented on the new image, however, we use a new level ∂ = (I −ILFI ) set which is devised by Kaihua Zhang in [20]. According to Zhang's work, two constraints and which are average At this point, we can use a same algorithm as the previous one intensities inside and outside of the contour, should be with our new level set function: evaluated by minimizing the energy function such as below • Extract the level set function in Equation 8 1 ∫ I x − c 2 dx ∫ I x −c 2 dx • If >0, then =1, else =-1 and a local segmentation Therefore, we have: The main goal of this article is to find out how a drug can ∫I(x H ). ( f )dx c ( f ) make changes in trachea and nasopharyngeal airways. Data ∫H( f )dx are gathered by University of Osaka in Japan. The dataset consisted of 5 sets of Nasal and trachea MR images. Each set has 29 slices of images and represents a specific time after the ∫I(x 1 ).( − H ( f ))dx c ( f ) drug was injected into the subject. Image matrix of each data ∫ 1(− H( f ))dx set is 256×256×29 with voxel size of 0.14×0.14×1mm .
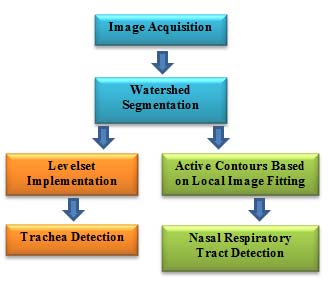
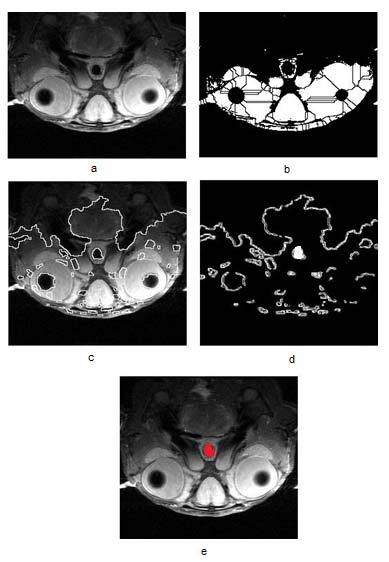
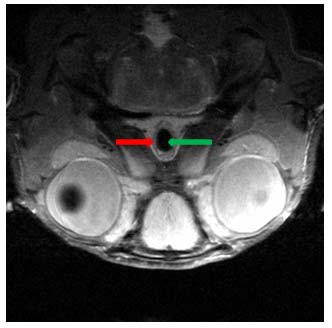
Fig. 1.Nasopharyngeal airway (green arrow) and trachea mucosa (red arrow) of guinea pig. The subject in these data are guinea pigs which are sensitized
by aerosol inhalation of antigen and this antigen challenge into
Fig. 2. Block diagram of our proposed method for drug evaluation in trachea
the nasal cavity increased both nasal vascular permeability and
and nasal respiratory tract.
intranasal pressure. Another effect of antigen challenge into
nasal cavity which may cause nasal blockage is swelling of sequences of the images. Second, the total effect of Azelastine nasal mucosa and a decrease in nasopharyngeal airway [22]. should be evaluated and compared against previous works Here, we study the effect of Azelastine drug, an antihistamine
on swelling of mucosa. A slice of guinea pig's nasopharyngeal
and it's mucosa is shown in Figure 1. Antigen would swell the
mucosa (red arrow) and antihistamine would inhibit that (green arrow).
B. Method Execution
In order to implement our method, we should follow the
block diagram in Figure 2. In this block diagram, first we must insert our data for a preprocessing step which is a watershed method implementation. In the next step, level set algorithm is applied to these data and results of trachea area segmentation is extracted. With these results of segmentation, we can calculate the trachea area for 20, 30, 40, 50 and 60 minutes after Azelastine injection. This process will continue for every slice of a MR image. For example, if a data set has 6 sets of 10 slices of MR images, we should implement our method on every set (which is related to a specific time after injection of Azelastine) and also on every slices of the desired set. After using our method, and finding nasopharyngeal airway area of each slice of an image, we will build a 3D model of nasopharyngeal airway area and its total volume will be extracted.
After injection of Azelastine, 5 sets of images were taken.
The first set had been taken after 20 minutes of injection, while the second set after 30 minutes, the third set after 40
minutes, the fourth set after 50 minutes, and the last set after an hour of injection were taken. Therefore, in order to evaluate
Fig. 3.The Enhanced Level set method for finding nasopharyngeal of guinea pig. (a) Original image. (b) Watershed regional segmentation. (c) Watershed
the effect of Azelastine, we should consider two points. First,
region and boundary finding. (d) Level set after70 iterations. (e) Final image
the trachea variations should be calculated through time with specified trachea area.
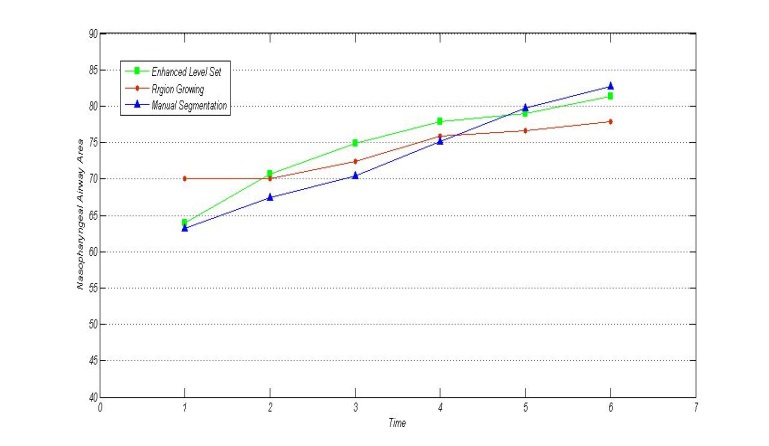
TABLE I AZELASTINE EFFECT IN NASOPHARYNGEAAL AIRWAY AREA AND VOLUME: A COMPARISON OF OUR PROPOSED METHOD WITH PREVIOUS STUDIES.
Trachea after antigen inhalation
Azelastine effect in Trachea area (
70.62 74.87 77.9 79.05 81.4 9.95
70.2 72.35 75.9 76.6 77.82 13.9
67.43 70.4 75.09 79.74 82.69
Fig. 4. Trachea area (
) before and after 20, 30, 40, 50 and 60 minutes of injection of Azelastine.
As mentioned in the previous section, we would implement
trachea area from a slice of a MR image. These methods are
our Enhanced level Set method on our MRI data to segment and find out it's efficiency for finding nasopharyngeal airway
enhanced level set, region growing and manual segmentation.
of guinea pig. Figure 3 shows the steps of our method as discussed in the proposed method section. At first, the
The exact area of trachea is shown in Table I with
watershed algorithm is applied on our image shown and the comparison to manual detection of trachea area and the simple result of local segmentation can be seen in Figure3.b. After Region Growing method. Table I shows that our method this step, the boundaries are highlighted and the new image is
produces similar results to manual detection of airway areas
ready for the level set method (Figure 3.c). At the beginning of
while Region Growing method has sporadic results for the last
evolving, the level set function,
images. In addition, in this table, the total effect of Azelastine
according to Equations 4 and 5. Then, by using Equation 6, after 60 minutes is compared to previous works [22]. Note that the level set function is calculated (Figure3.d), and finally by the actual area of trachea before any inhalation is 90. 4
setting the positive level set to 1 and otherwise to -1, the local
segmentation of nasopharyngeal will be achieved as can be seen in Figure 3.e. In this task, the contours are stopped after
According to Table I and Figure 4, we can say that our
70 iterations as can be observed in Figure 3.d. This is while method has results with most similarity to Yamasaki work more iterations would be time consuming, and less iterations [22]. It is also notable that the Enhanced Level Set method has would lead to global segmentation.
faster results than manual segmentation results, especially
By finding the trachea area now, we can estimate the when we face large amount of data for processing. An
variation through time, total variation and total volume change
important point from these results is that various methods had
which is discussed above.
proven that after some time has passed, the Azelastine will
First, we study the effect of Azelastine after injection as reduce and quell the swelling effect of antigen. In Table, I the
time goes on. The area of trachea after injecting antihistamine
trachea area is increasing for consecutive images through time
will vary and these changes can be seen in Figure 4. In this and this increase is proven with different methods. Moreover, figure, the trachea area size after 20 minutes of Azelastine we can realize that this increase is a demonstration for injection until 60 minutes after injection is depicted. As can be
decrease in swelling of nasal mucosa which is a result of
seen in Figure 4, three different methods are used to find
antihistamine administration.
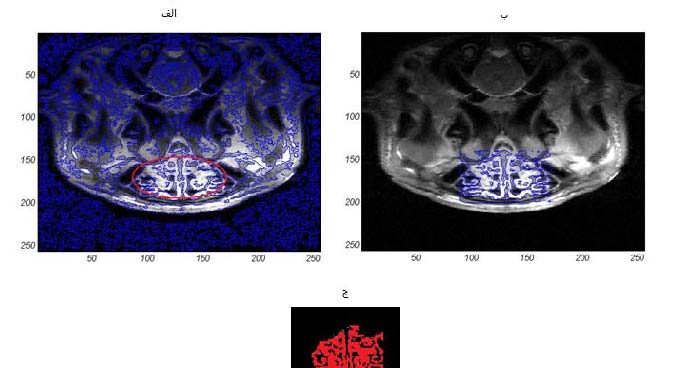
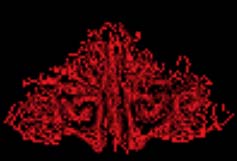
Fig. 5.Segmentation of nasal respiratory tract airways based on local image fitting [23].
Fig. 6. 3D model of trachea volume of guinea pig before injection of Azelastine and after 20, 40 and 60 minutes of injection (from right to left).
Using active contours based on local image fitting allows us to
level set method to find trachea areas of the same image and
segment nasal respiratory tract parts of our images which is again a 3D model is constructed based on these segmentation
shown in Figure 5. After detecting nasal respiratory tract results. Finally, we overlap these two 3D models to find out an
through continuous slices of MR images, we can create a 3D
intuitive concept of nasopharyngeal volume and also to
model of the trachea.
compare the model which is based on our enhanced level set
method with the model rooted from manual segmentation. Figure 7 represents this concept, and as it can be seen, our
IV. 3D VISUALIZATION
method has meaningful overlaps with the manual segmented method.
Another way to compare our results with previous works is
The total volume of trachea area before and after injection
to find a three dimensional model of trachea area. This way of Azelastine is shown in Table I for different methods. This
we can evaluate the total effect of Azelastine drug and figure volume can help the physician to understand the effect of
out how the volume of trachea area will vary through time Azelastine in the trachea area. In this table, the total volume
sequences. Figure 6 shows trachea volume in three different before Azelastine administration (antigen inhalation) and after
times. The first trachea volumetric model is before injection of
1 hour of Azelastine administration is calculated. Note that the
Azelastine, and the two others are after 20, 40 and 60 minutes
total volume of trachea has an increase before and after
of drug injection. With this 3D model, we can estimate the Azelastine administration which shows that swelling of nasal
volumetric changes of trachea in order to evaluate the effect of
mucosa has a decrease after the injection of Azelastine.
The same procedure can be used in order to create a 3D
Volumetric comparison of trachea area can be done by model of nasal respiratory tract airways based on our
overlapping the results of our proposed method and manual segmentation results for each slices. Therefore results of our volumetric model. For this aim, first a 3D model is detected nasal respiratory tract area from consecutive slices constructed based on manual segmentation of trachea areas can be visualized into a 3 dimensional model as shown in from slices of the MR image. After that, we use our enhanced
In this paper, we presented a new fusion of segmentation
methods for evaluating the trachea area. Our method combines active contour algorithm with the watershed method. The aim of this work is to find out how an antihistamine drug can prevent nasal mucosa swelling. This work can help the physician to define and query the effect of a drug from medical images and thus they can anticipate the probability of allergic rhinitis. This diagnosis is extremely crucial, because the developed forms of allergic rhinitis could lead to asthma. The conclusion process in this work is based on the sequential variations in the trachea area and its total final area after histamine drug (Azelastine) injection. In addition, we extracted a 3 dimensional model of trachea area in order to
observe the total volume changes due to Azelastine
administration. The results of this work show that an
Fig. 7. 3D model of trachea volume based on manual (red) and enhanced level set method (blue) segmentation.
antihistamine drug (Azelastine) has good effect on swelling of
nasal mucosa and will reduce it. As a future direction of this work, we plan on estimating the total volume of trachea and see how its volume will change after histamine injection.
[1] J. E. Sherwood, D. A. Hutt, W. Kreutner, J. B. Morton and R. W.
Chapman, "A magnetic resonance imaging evaluation of histamine-mediated allergic response in the guinea pig nasopharynx," J. Allergy Clin. Immunol, vol. 92, pp.435-441, 1993.
[2] H. Mizuno, Y. Kawamura, N. Iwase and H. Ohno, " Effects of
flutropium on experimental models of drug- and allergy-induced rhinitis in guinea pigs," Jpn. J. Pharmacol, vol.55, pp.321–328, 1991.
[3] M.de Smet, E. Heijman, S. Langereis, NM. Hijnen, H.
Grüll,"Magnetic resonance imaging of high intensity focused
Fig. 8. 3D model of nasal respiratory tract airways based on local image
ultrasound mediated drug delivery from temperature-sensitive
fitting segmentation.
liposomes: an in vivo proof-of-concept study," J Control Release,
Vol.150, no.1, pp. 102-10, 2011.
Finally, for a set of MR images which is consisted of 29 [4] S. Langereis, J. Keupp, JL. Van Velthoven, IH. de Roos, D.
slices, we can create a 3D model in which some slices just
Burdinski, JA. Pikkemaat and H. Grüll,"A temperature-sensitive
show nasopharyngeal, while others include the nasal
liposomal 1H CEST and 19F contrast agent for MR image-guided drug delivery," J Am Chem, vol.131, no.4,pp.1380-1, 2009.
respiratory tract area which is shown in Figure 9.
[5] A. Yudina, M. de Smet, M. Lepetit-Coiffe, S. Langereis, L. Van
Ruijssevelt, P. Smirnov, V. Voisin and H. Gruell, "Ultrasound-
mediated intracellular drug delivery using microbubbles and
temperature-sensitive liposomes," J. Control Rel. ,vol.155, pp.442-448, 2011.
[6] R. Deckers, A. Yudina, LC. Cardoit and CT. Moonen, "A
fluorescent chromophore TOTO-3 as a 'smart probe' for the assessment of ultrasound-mediated local drug delivery in vivo," Contrast Media Mol Imaging, vol.6, pp.267-274, 2011.
[7] J. Rogowska, K. Preston, G.J. Hunter, L. M. Hamberg, K. K.
Kwong, O. Salonen, and G.L.Wolf," Applications of Similarity Mapping in Dynamic MRI", IEEE Transactions on Medical Imaging,vol.14, no.3, pp.480-486, 1995.
[8] P.D. Sathya and R. Kayalvizhi, "PSO-Based Tsallis Thresholding
Selection Procedure for Image Segmentation," International Journal of Computer Applications, vol.5, no.4, pp. 39-46, 2010.
[9]O. Bezvesilniy, V. Vinogradov, D. Vavriv and K. Schunemann,
"Wavelet-based image processing: edge detection and noise reduction," 17th International Conference on Applied
Electromagnetics and Communications, pp.123-126, 2003.
Fig. 9. Complete 3D model of nasopharyngeal and nasal respiratory tract
[10] J. A. Jiang, C. L. Chuang, Y.L. Lu and C. S. Fahn,
airways for 1 set of 29 slices of MR images.
"Mathematical morphology-based edge detectors for detection of
thin edges in low-contrast regions", Image Processing, The
[18] J. A. Sethian. "Level Set Methods and Fast Marching Methods:
Institution of Engineering and Technology (IET), vol. 1, no. 3, pp.
Evolving Interfaces in Geometry, Fluid Mechanics, Computer
Vision and Materials Sciences," Cambridge Univ. Press, 1996
[11]S. Narita, K. Asakura, and A. Kataura, " Effects of thromboxane
[19] D. Enright, F. Losasso, and R. Fedkiw, "A fast and accurate
A2 receptor antagonist (Bay u 3405) on nasal symptoms after
semi-lagrangian particle level set method, " ACM Computer and
antigen challenge in sensitized guinea pigs," Int. Arch. Allergy
Structures, vol. 83, no. 6-7, pp. 479-490, 2004.
Immunol., vol. 109, pp. 161–166, 1996.
[20] K. Zhang, L. Zhang, H. Song and W.Zhou, "Active contours
[12] P.S.Norman, "Allergic rhinitis," J. Allergy Clin. Immunol,vol.75,
with selective local or global segmentation: A new formulation
pp. 531–545, 1985.
and level set method," Image and Vision Computing, vol. 28, pp.
[13] G. D. Raphael, J. N. Baraniuk and M. A. Kaliner, "How and
668–676, 2010.
why the nose Runs," J. Allergy Clin. Immunol., vol. 87, pp.
[21] D. Mumford, J. Shah, "Optimal approximation by piecewise
457–467, 1991.
smooth function and associated variational problems,"
[14] A. Bieniek and A. Moga, "An efficient watershed algorithm
Communication on Pure and Applied Mathematics, vol. 42,
based on connected components," Pattern Recogn., vol. 33, no. 3,
pp.577–685, 1989.
pp.907-916, 2000.
[22] M.Yamasaki, T. Matsumoto, S. Fukuda, T. Nakayama, H.
[15] S. Chen, J. Luo, Z. Shen, X. Hu, L. Gao, "Segmentation of
Nagaya and Y. Ashida," Involvement of Thromboxane A2 and
Multi-spectral Satellite Images Based on Watershed Algorithm",
Histamine in Experimental Allergic Rhinitis of Guinea Pigs," The
IEEE International Symposium on Knowledge Acquisition and
Journal of Pharmacology & Experimental Therapeutics, vol. 280
Modeling, KAM '08, pp. 684-688, Institute of Remote Sensing
, no.3, pp. 1471-1479 , 1997.
Application, Chinese Academy of Sciences, Beijing, China, 2008.
[23] K. Zhang, H. Song, and L. Zhang, "Active contours driven by
[16] N.Salman and C. Q. Liu, "Image Segmentation and Edge
local image fitting energy," Pattern Recognition, vol. 43, no.
Detection Based on Watershed Techniques," International
4, pp. 1199-1206, 2009.
Journal of Computers and Applications, vol. 25, no. 4, pp. 258-
[17] S. Beucher and F. Meyer,"The morphological approach to
segmentation: The watershed transformation," Mathematical Morphology in Image Processing, pp. 433–481, 1993.
Source: http://www.asee.org/documents/zones/zone1/2014/Professional/PDFs/55.pdf
quantil.com.co
Financial incentives and pharmaceutical prices: The Colombian Mauricio Romero∗ "At a time when money is tight, my advice to countries is this: before looking for places to cut spending on health care, look first for opportunities to improve efficiency" Dr. Chan, Director of the World Health Organization. The Colombian health care system is a competitive insurance market with a standardized health
Microsoft word - sangalli_lamieri.docx
A spatial econometric model for productivity and innovation in the manufacturing industry: the role played by geographical and sectorial distances between firms° Ilaria Sangalli*, Marco Lamieri** Abstract The paper assesses spillovers from total factor productivity (TFP) in the Italian