Climatechange.lk

NAMA Design
Document for
Transport Sector of
Sri Lanka
Contents
Transport and Development
Nationally Appropriate Mitigation Actions (NAMAs)
A Transport NAMA – An Opportunity for Sustainable, and Inclusive Green Growth in Sri
Transport Sector in Sri Lanka
The Millennium Development Goals
Transport Sector Overview
Policy Environment
Stakeholders in the Transport Sector
NAMA Baseline and Targets
Challenges faced by CMA's transport sector
Introduction of electric buses on the planned Bus Rapid Transit (BRT)
Alignment of the NAMA Objectives and Targets with National Strategies and Transformative
NAMA Baseline Scenario
NAMA Technical Intervention
NAMA Intervention – Promotion and adoption of electric buses on the Galle Road Bus Rapid
An Introduction to Electric Buses
Activities under the NAMA
Eligibility Criteria for NAMA Funding
Approval Structure of the NAMA
NAMA Implementation Structure
Actions to Institutionalize the NAMA
Institutional Framework for NAMA Implementation and Management
NAMA Capacity Development Needs
NAMA Capacity Development Program
Component 1: Capacity Development for NAMA Launch and Implementation
Component 2: Awareness Raising and Marketing
NAMA Costs and Finance
Proposed Investment in the Galle Bus Rapid Transit
Error! Bookmark not defined.
Financial Analysis of the NAMA intervention
Error! Bookmark not defined.
Financing Mechanism for the Sri Lanka Transport NAMA
Error! Bookmark not defined.
NAMA financing through a combination of grants and soft loansError! Bookmark not defined.
NAMA Measurement, Reporting and Verification
NAMA Measurement, Reporting and Verification Framework
Measurement and Monitoring of GHG Emissions Reductions
Measurement and Reporting of Sustainable Development Benefits
Measurement and Reporting of NAMA Support
Monitoring, Reporting and Verification (MRV) Management Framework
Verification Mechanisms
NAMA Implementation Plan
NAMA Implementation Flow
Establishing NAMA Institutional Structure
Securing International and National Funding
Implementation of NAMA Intervention
References
Annexures
Annexure A: Financial Assessment
Appendix B: Emissions Calculations
Appendix C: Sustainable Indicators
1. Introduction
1.1. Transport and Development
Mobility of goods and people from one place to another has been an integral part of human existence
since the dawn of civilization and as a result, transport activity is considered to be one of the most
essential components in economic development and human welfare. In today's world, this activity,
motorized transportation in particular, is growing at a rapid pace and will continue to grow, fuelled by the
growth of economies around the world, especially developing economies.
While the growth of the transport sector drives increased economic growth globally through the facilitation
of specialization and trade, it is also fast becoming the highest emitter of greenhouse gases globally,
resulting in a large contribution to climate change. As of 2010, the transport sector was responsible for
producing 7.0 GtCO2eq of direct GHG emissions, including non-CO2 gases. Out of the 7.0 GtCO2eq of
GHG emissions, CO2 emissions constitute 6.7 Gt which translates to 23% of the total energy-related CO2
emissions globally (IPCC, 2014).
Figure 1: Direct emissions of the transport sector (250% increase from 1970 to 2010) (Source: IPCC, 2014)
94% of the total energy used by world transport is sourced from a single fossil fuel, petroleum. The global transport sector's excessive reliance on fossil fuels for energy, has resulted in a continued growth in GHG emissions in spite of more efficient vehicles (road, rail, water craft, and aircraft) and policies being
adopted. Without robust mitigation policies being implemented, transport emissions could increase at a
faster rate than emissions from the other energy end-use sectors and reach around 12 Gt CO2eq/year by
2050 (IPCC, 2014).
Furthermore, while transport demand per capita in developing economies is currently far lower than that
in OECD countries, given the rapid growth of developing economies, the demand per capita is likely to
increase, subsequently resulting in a further increase in GHG emissions, thus aggravating the situation
further. Hence, while the transport sector plays an integral role in the growth and development of the global economy, the world's dependence on fossil fuels to drive and grow the sector is untenable, from the perspectives of both resource management (petroleum is a finite resource) as well as global efforts to
abate the effects of climate change.
In light of the current scenario of transportation in the world, it is imperative that countries especially
developing economies develop sustainable, inclusive green growth strategies that will simultaneously
help achieve GHG emissions reductions and reduce the sector's dependence on fossil fuels. These
strategies could entail multiple measures including modal shifts to low-carbon transport systems such as
BRT systems and the use of alternative technologies that reduce the carbon intensity of fuels (e.g. use of
electric vehicles). Apart from providing direct GHG reduction benefits, sustainable transport strategies
also provide multiple sustainable development benefits such as cleaner air and improved health benefits
due to reduced pollution as well as employment creation through the development of ancillary industries.
However, while sustainable transport strategies involve low operational costs especially when compared
to conventional fossil fuelled transport strategies, they require higher initial capital costs. Additionally,
there are challenges of local-level maintenance, availability, and awareness of the technologies, which
remain barriers to increased uptake. These challenges are compounded by the traditional issues faced by
public modes of transport (e.g. buses, railways) such as low quality of service, low frequency, poor
access, lack of integration with other modes of transport, etc. All of which contribute to a very poor image
of public transport, leading consumers to veer towards conventional modes of private transport, thereby
resulting in higher GHG emissions. Thus, in order to increase the adoption of alternative, cleaner
technologies in the transport sector it is essential to establish robust support mechanisms for successful
deployment of alternative forms of transportation. As sector-transforming instruments, Nationally
Appropriate Mitigation Actions (NAMAs) have the potential to increase the adoption of sustainable and
low emission modes of transport in developing countries.
1.2. Nationally Appropriate Mitigation Actions (NAMAs)
NAMAs are voluntary, non-binding policy instruments that provide a framework for pursuing a country's
socio-economic and development goals, while contributing towards global greenhouse gas mitigation
efforts. They were first introduced at the 13th Conference of the Parties (COP13) in Bali in 2007. Many
developing countries are taking steps to develop and implement NAMAs; they can help countries achieve
their growth objectives and participate in the global climate change mitigation agenda. NAMAs help
governments leverage national and international support to achieve appropriate, effective and
transformational GHG mitigation and sustainable development targets for the country and within
COP 19 in 2013 saw the introduction of Intended Nationally Determined Contributions (INDCs), which
were to be submitted by all parties, developed and developing, to the United Nations Framework
Convention on Climate Change (UNFCCC). The INDCs are for the period following 2020 and detail the
actions the parties will take to address climate change. The types of actions (e.g. mitigation, adaptation)
and the means of implementation to be included are yet to be determined. While the exact relationship
between INDCs and NAMAs is yet to be clearly defined, both incorporate short/medium-term goals, with
NAMAs also acting as a possible implementation tool to translate those short/medium-term goals into
action by outlining the means and action plans to implement them (GIZ/UNEP, 2014).
1.3. A Transport NAMA – An Opportunity for Sustainable, and
Inclusive Green Growth in Sri Lanka
NAMAs can be seen as one of the most promising voluntary instruments for reducing GHG emissions in
developing countries while offering flexibility as to the interventions that can be employed. However, the
objectives of a NAMA must go beyond its desired impact on GHG emission reductions to include the
achievement of significant sustainable development goals that can benefit the country and its inhabitants
Even though NAMAs are often praised as an innovative instrument of climate policy, the basic concepts
are well known and established in developed countries in the form of national climate and environmental
policies. The new elements are their transformation to address the special needs and circumstances of
developing countries, and the availability of international financial and technical support for their
implementation from developed partners.
Since the end of a three-decade long war, Sri Lanka has made good progress in restoring transport
infrastructure and services throughout all provinces of the country. However, the growth of the sector has
come at an ecological, social and economic cost, with most of the steps taken increasing Sri Lanka's
dependence on the use of conventional fossil fuel driven modes of transportation. The lack of robust
public transportation networks has also led to an increase in the adoption of private, low occupancy
means of transportation giving rise to issues of urban congestion and pollution.
While Sri Lanka's existing policy framework targets these issues through various policies aimed at increasing the reach and utilization of public transport systems like buses and railways as well as the
adoption of alternative, cleaner modes of transportation like hybrid vehicles, a marked lack of financing is
hindering the successful implementation and deployment of these policies.
Thus, a NAMA framework that promotes the adoption of clean and sustainable transportation
interventions, presents a novel solution to the problem at hand by providing access to international
finance which can help forward programs and policies that promote the use of electric buses in a BRT
system, in turn resulting in reduced GHG emissions and increased sustainable development benefits.
The proposed transport NAMA for Sri Lanka focuses on the promotion and adoption of electric buses in a
BRT, thus addressing the objectives of reduction in GHG emissions and multiple SD objectives like
increased energy security, improved access to transportation, improved air quality and local job creation
The NAMA differs from traditional funding mechanisms which promote sustainable transport because of
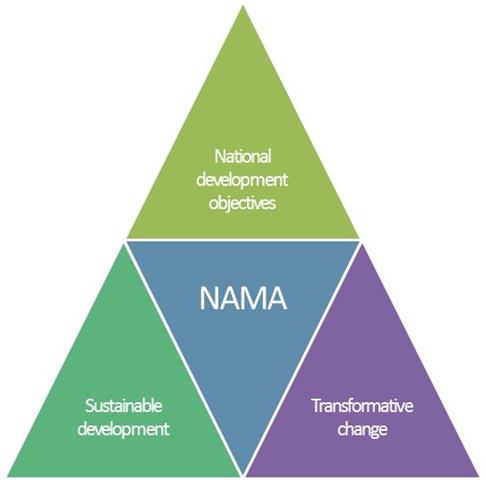
three key components, summarized in Figure 2:
Alignment with country objectives: The intervention under the NAMA framework are prioritized
in line with the socio-economic development objectives of the host country. It takes into account
the current social, economic and policy landscapes of the Sri Lankan transport sector and
provides innovative technical and financial mechanisms to augment them and help Sri Lanka
achieve its sectoral and country objectives like increased energy security, reduced environmental
damage and employment creation, among others.
Focus on sustainable development: The NAMA is designed with sustainable development
benefits in mind. The design includes a focus on the development and implementation of an
intervention that provides additional sustainable co-benefits like cleaner air, employment
generation through the promotion of ancillary industries, an increased energy security due to a
reduced dependence on fossil fuels, among others.
Facilitates transformative change: The NAMA will spur the development of an environment
which facilitates transformative change in the transport sector. An enticing regulatory and policy
environment which incentivizes the participation of the private sector will be created, thus ensuring the intervention's longevity and sustainability. The business models associated with the NAMA intervention will be developed in a manner that can be easily replicated in other
communities across the country.
Figure 2: Components of a NAMA
The NAMA framework has been designed to be embedded into existing Sri Lankan sectoral development
goals and objectives The NAMA will build on the feasibility studies carried out by JICA on behalf of the Sri Lankan Government ("Urban Transport System Development Project for Colombo Metropolitan Region
and Suburbs") and Sri Lankan Government's Department of Transport and Logistics Management, along with the faculty of engineering of the University of Moratuwa ("Study of Implementation of Bus Rapid Transit on Galle Road"), detailing the suitability and feasibility of a BRT (modal shift to low-carbon transport system) in the capital city of Colombo by introducing electric buses, replacing conventionally
fossil fuelled buses in the BRT (alternative technologies that reduce the carbon intensity of fuels).
2. Transport Sector in Sri Lanka
2.1. Geography
Sri Lanka is situated in the south eastern part of Asia, with a total land area of about 62,710 sq.km.
(World Bank, 2015a). It is a tropical island lying close to the southern tip of India and near the Equator. The country's population, according to the 2012 Population and Housing Census was 20,271,464. The annual growth rate of the population is 1.0 percent over the past 31 years. Majority of the population
(28.7%) is concentrated in the Western province making its population density 1,621 persons per sq.km
as against the national average of 323 persons per sq.km. The percentage of urban sector population is
reported as 18.3 percent followed by 77.3 percent in rural sector and the balance of 4.4 percent in the
estate sector (Government of Sri Lanka Department of Census and Statistics, 2012).
Figure 3: Map of Sri Lanka
2.2. The Economy
Economic growth in Sri Lanka has been among the fastest in South Asia in recent years. Growth
averaged 6.3 percent between 2002 and 2013, with Gross Domestic Product (GDP) per capita rising from
USD 859 in 2000 to USD 3,256 in 2013 (World Bank, 2015b). The annual growth rate in GDP of the
country since 2005 is illustrated in the figure below.
Real GDP Growth Rate (%)
Figure 4: Sri Lanka's GDP Growth, 2005-2013 (Source: ADB, 2015)
The GDP grew by 7.4% during 2014, up slightly from 7.2% in 2013. The continued high growth was
driven by faster expansion in industry, which offset substantially weaker growth in agriculture (ADB,
2.3. The Millennium Development Goals
In 2000, world leaders adopted the United Nations Millennium Declaration and, along with it, the
Millennium Development Goals (MDGs) which aimed to reduce extreme poverty by 2015.
The Government of Sri Lanka also signed the Millennium Declaration along with other member countries
of the United Nations (UN). It further included the MDGs into its ten year development plan "Mahinda
Chintana: Vision for a new Sri Lanka" which extends from 2006 to 2016, thus according high priority to
achieving them and showing the determination to meet set targets within stipulated time frame. Key
initiatives introduced by the Government in this context include the establishment of Dairy villages,
Irrigation rehabilitation, Medicinal herbal villages, Industrial villages, Community managed water supply
schemes, Rural IT centers and Programmes to improve rural infrastructure (Government of Sri Lanka
Department of Census and Statistics, 2008).
The latest MDG Country Report, jointly launched by the UN and the Government of Sri Lanka earlier in
2015 demonstrates Sri Lanka's progress in achieving seven out of the eight relevant development goals
that were agreed by the world leaders in 2000 (United Nations, 2015). These have been summarized in
the following table:
Millennium Development Goals
Sri Lanka's Performance
Sri Lanka achieved the target of halving poverty at the national level seven years before 2015.
MDG 1: Eradication of Extreme
National poverty incidence declined from 26.1 percent in 1990-1991 to 6.7
Poverty and Hunger
percent in 2012-2013.
The urban sector reached the target in 2000; the rural sector in 2008.
Sri Lanka has almost achieved universal primary education, and the proportion of pupils starting grade 1 who reach grade 5 is nearly 100 percent.
The literacy rate of 15 to 24 year olds increased from 92.7 percent in 1996
Primary Education
to 97.8 percent in 2012.
This increase is seen in all regions with the rate for females at 98.2 percent, exceeding the rate for males at 97.2 percent.
Sri Lanka has almost reached gender parity in primary education.
The ratio of girls to boys reached to 99.4 percent in 2012.
MDG 3: Promote Gender Equality
The share of women in wage employment in the non-agricultural sector,
and Empower Women
however, has not changed.
The proportion of seats held by women in the national Parliament remains very low.
Sri Lanka is on track to achieve the target of reducing both the under-five and infant mortality rates by two-thirds of the level of the base year by 2015, if
MDG 4: Reduce Child Mortality
present trends continue.
The proportion of one-year-old children immunized against measles increased from 95.5 percent in 1993 to 99 percent in 2011.
Sri Lanka is expected to meet the target of reducing the ratio by three-fourths over the baseline year of 1990.
The maternal mortality ratio declined from 92 deaths per 100,000 live
MDG 5: Improve Maternal Health
births in 1990 to 33.3 in 2010.
The proportion of births attended by skilled birth attendants, more than 70 percent of whom were doctors, had almost reached the target of 99.8 percent in 2010.
Although Sri Lanka remains a low prevalence country, the number of HIV/AIDS cases is gradually increasing.
Sri Lanka has managed to bring malaria cases down from 400,000 in the
Malaria and Other Diseases
early 1990s to 23 by 2012.
No indigenous cases since November 2012 and no malaria-related deaths since 2007.
Total forest cover has fallen.
Carbon dioxide emissions more than trebled between 1990 and 2004, but
MDG 7: Ensure Environmental
stabilized after 2004.
Sri Lanka has met the target for the proportion of people with access to safe drinking water and basic sanitation.
ODA flows received as a percentage of Sri Lanka's gross national income (GNI) fell from 1.5 percent in 1997 to 1 percent in 2011.
Sri Lankan imports admitted duty free into developed countries significantly declined from almost 70 percent in 2010 to 37.5 percent by
Partnership for Development
Sri Lanka's debt-services-to-exports ratio remains relatively high compared to other developing countries in Asia-Pacific.
Telephone density has increased rapidly with the number of telephone connections exceeding the country's population.
Table 1: Sri Lanka Millennium Development Goals (MDG) Progress
While the Millennium Development Goals are on their way to being replaced by Sustainable Development
Goals (SDGs), which will come into effect from the 1st of January 2016, the MDGs still form a strong base
on which to adopt and further the SDGs.
2.4. Transport Sector Overview
The transport sector has played a crucial role in the economic and social upliftment of Sri Lanka. In 2003,
the sector contributed to 10 percent of the country's GDP and generated about 4 percent of employment
(World Bank, 2015c). By 2012, the contribution to GDP had increased to 14 percent (Government of Sri
Lanka Department of Census and Statistics, 2013). However, the sector is also responsible for a majority of the country's greenhouse gas (GHG) emissions – almost half of the total emissions in the energy
sector are from transportation.
Sri Lanka depends heavily on its public transportation systems with buses and trains forming the
backbone of the system with limited presence of sea and air transport in the domestic setup. The
domestic passenger transport sector is primarily made up of cars, vans and motor cycles for private
transport, while the public transport sector largely consists of buses and a small percentage of para-
transit vehicles.
The various modes of transport prevalent in the country are discussed below:
Road Transport: Roads are the backbone of the transport sector in the country. They are vital for the
movement of people and goods and play an important role in integrating the country, facilitating economic
growth, and ultimately reducing poverty. National roads carry over 70 percent of the traffic in Sri Lanka
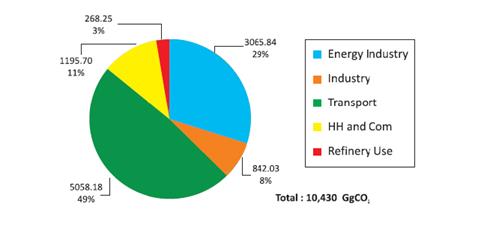
Figure 5: Breakup of CO2 emissions in Sri Lanka
(Source: Government of Sri Lanka Ministry of Environment, 2011)
2015c). The country currently has around 11,700 km of major national highways, supplemented by
15,500 km of provincial roads, 65,000 km of local authority roads and about 24,000 km of roads owned or
controlled by irrigation, wildlife and other government authorities (Government of Sri Lanka Ministry of
Environment, 2011).
Within the road sector, buses dominate the passenger transport section as seen in the modal share
(2007) figures given below (University of Moratuwa, 2011).
As of 2012, the demand for passenger travel was around 80 billion passenger-kilometres (pkm) per year,
of which road transport accounts for 93%. About 97% of freight traffic, measured in ton-km, is conveyed
by road (ADB, 2012). Therefore, it is evident that roads dominate Sri Lanka's transportation landscape,
both for passenger as well as freight movements.
Figure 6: Modal share of road transport
(Source: University of Moratuwa, 2011)
Railways: Sri Lanka has around 1,450 km of railway track, an amount that has not changed since its
independence, most of which is limited to single gauge track. The railway fleet is currently made up of
about 200 diesel electric locomotives along with 46 diesel power sets and is responsible for carrying about 5% of Sri Lanka's total passenger traffic, amounting to around 4,567 mil ion passenger-kilometres annually (2009). While Sri Lanka Railways (SLR) played a dominant role in the country's transport sector
until 1928, its share in passenger and freight transportation has reduced drastically. The freight
movements handled by the railways has come down drastically from 32% in 1979 to a paltry 1% today,
emphasising the need of an overhaul in this sector. The railways continue to face serious competition
from road transportation, and have been adversely affected by the country's two-decade war on terrorism.
Ports: Sea transport in Sri Lanka, with the three major ports of Colombo, Trincomalle and Galle, handles
the bulk of Sri Lanka's freight imports and exports. There is little to no movement of passengers or freight
within Sri Lanka by sea. Most of the internal movement is restricted to inland waterways with ferries and
fishing boats plying both passengers and cargo. The Port of Colombo, the country's premier commercial
port, is considered to be one of the premier ports in Asia. It handles both conventional cargo as well as
containers, and has been acknowledged as one of the most economical ports in the region. After
economic liberalization, a port expansion program, and the onset of containerization and trans-shipment
cargo, port traffic grew at an average rate of 6.5% per year and reached the equivalent of 4 million
containers of twenty-foot equivalent units in 2010 (ADB, 2012).
Air Transport: Sri Lanka has one international airport and 13 domestic airports with 2 national carriers
operating international as well as domestic routes. The civil aviation sector has seen healthy growth in
recent times, though most of this growth has come from international passenger and cargo movements.
The table below illustrates that while the transportation sector as a whole is important to look at in terms
of NAMA opportunities, given the modal mix of GHG emissions within the sector where roads are
responsible for 88% of the total emissions, followed by the air sector as a distant second (9%), it is prudent to focus on NAMA opportunities specifically in Sri Lanka's road transportation sector.
Emissions (Gg)
Table 2: Modal mix of GHG Emissions (Transportation)
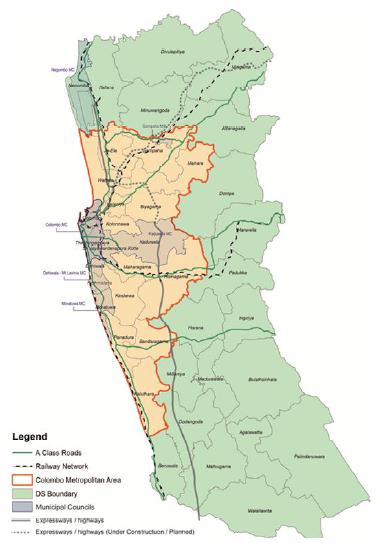
The Colombo Metropolitan Area (CMA)
The Colombo Metropolitan Area (CMA), which consists of the Colombo Municipal Council (CMC) and its
adjacent areas is the largest metropolitan area in Sri Lanka with a population of 3.7 million as of 2012.
This is estimated to grow to 5.1 million by 2035 bringing along with it increased economic growth and
demand for transportation.
During this period, it is estimated that population growth will result in a 1.75 times increase in the total
person trip demand. This increase is going to be accompanied by a significant increase in trip demand
made by private modes of transportation, a result of the economic growth of individual households.
The increase in private traffic demand coupled
with a number of issues such as reduced
utilization of high occupancy vehicles, lack of
capacity of public modes of transportation,
inefficient road and traffic control infrastructure
has led to a degradation in the speed of vehicles
on the roads of Colombo resulting in higher
operating costs for vehicles (economic damage)
(environmental damage) throughout the city of
Colombo. Given the status of Colombo as the
economic driver of the country where it is responsible for almost half of Sri Lanka's economic activities, the negative effects of an
ailing transportation system is felt throughout the
Furthermore, the capital intensive nature of
transportation infrastructure makes it difficult for
the Sri Lankan government to develop all the
facilities required to alleviate the current situation
of transportation in Colombo, all by itself.
Thus, given the importance of Colombo and the
nature of investment required, it was deemed
Figure 7: Colombo Metropolitan Area (CMA)
prudent to look at international donor support in
the form of NAMAs to kick start transportation
projects that will help Sri Lanka develop sustainable, economic and efficient modes of urban
transportation, not just in Colombo but throughout the country.
2.5. Policy Environment
The Sri Lankan transport landscape is governed by a number of policies that include policy frameworks
that were designed solely to cater to the transport sector as well as frameworks that view the transport
sector through a broader lens of climate change and sustainable development. These policies have been
detailed in the following sections:
National Transport Policy
The ‘Draft National Policy on Transport in Sri Lanka', 2008 by National Transport Commission, Ministry of Transport is the key document addressing the national objectives and strategies for Sri Lanka's transport sector. The objective of this National Policy is to set out explicitly, the interventions of Government in ‘ensuring that existing and potential mobility needs within the country for passengers and goods transport are satisfied safely and efficiently at least cost to the economy by using the minimum amount of
resources and causing least impact on the environment'.
The main objectives which are, directly or indirectly, in support of the identified NAMA intervention are:
To encourage the use of public transport, high occupancy vehicles and non-motorized transport,
under the Section ‘Modal preference and Choice'.
To take steps to reduce the dependency on petroleum fuels for the country's mobility
To reduce the number of vehicles circulating within urban area in order to make a greater
proportion of limited road space available for high occupancy vehicles.
To ensure that at least 1/3rd of existing road space on major highways within a dense urban area
be reserved for high occupancy vehicles. Such areas to be utilized for high priority bus lanes, light
transit systems (trams) or bus rapid transit (BRT) systems.
Providing incentives (such as tax rebates) for new technologies such as hybrid vehicles and new
source of fuel such as bio fuel is a proposed intervention
National Action Plan for the Haritha Lanka Programme
The National Action Plan for the Haritha Lanka Programme, 2009 is the product of the concerted effort of
various ministries in Sri Lanka, which lays down the proposed strategies and actions that are set out to
focus on fulfilling the ten mission statements of the programme. The main objectives of the Plan which
are, directly or indirectly, in support of the identified NAMA intervention are:
Implementation of mass transit systems such as ‘MRT/LRT, BRT including Premium Bus- Service
& one-way systems with centre-flow bus lanes in metropolitan regions', as a strategy for meeting
Mission 1: Clean Air Everywhere
Promoting the use of alternate transport fuel technologies that reduce GHG emissions, as part of
Mission 3: Meeting the Challenges of Climate Change
Introduction of efficient public transport systems including bus lanes where necessary, MRT
systems, LRT systems, etc. integrated in the townscape in an aesthetic manner, as a strategy
towards meeting Mission 8 : Green Cities for Health and Prosperity
Mahinda Chintana - Vision for the Future (Development Policy
Framework)
The Mahinda Chintana vision is based on the economic philosophy that the growth in Gross Domestic
Product (GDP) alone would not bring economic prosperity to the society. Followed by the ‘Mahinda Chintana Vision for a new Sri Lanka' which was prepared in 2005, ‘Mahinda Chintana – vision for the Future' was prepared by Department of National Planning, and Ministry of Finance & Planning in 2010.
The main objectives which are, directly or indirectly, linked with the identified NAMA intervention are:
Complementary public transport systems like Bus Rapid Transit (BRT), Light Rail Transit (LRT)
and Mass Rapid Transit (MRT) systems will be introduced to Colombo and suburbs providing
more choices of different modes.
Environmental sustainability will be achieved through the use of electric vehicles and hybrid
vehicles in the transport sector to increase the efficiency and reduce pollution.
Other proposed activities include electrification of trail transportation, a high speed monorail transport
system for Colombo, and, construction of Mass Rapid Transit Underground rail system in the city limits
connecting other rail lines thereby linking all parts of the country Buses with a greater seating capacity,
television, radio and internet facilities.
The policy also proposes enhancement of private sector participation by strengthening Public-Private
Partnerships (PPPs) and opportunities for Foreign Direct Investments (FDIs).
Urban Transport Master Plan
The Urban Transport Master plan unites road network with economic development and provides for
approaches to long-term maintenance of the road network in the country and to safeguard adverse social
and environmental impacts of transport. The Plan is a highly comprehensive document that proposes
various strategies for public transport and road networks, while also taking into consideration the
institutional setup and financial arrangements for the proposed activities.
One key proposed intervention is to set up a BRT system in Colombo, and promotion of hybrid cars and electric vehicles is also proposed as a ‘policy measure for air pol ution and traffic noise reduction and promotion of health in transport'.
National Climate Change Policy
The National Climate Change Policy of Sri Lanka has been developed to provide guidance and directions
for all the stakeholders to address the adverse impacts of climate change efficiently and effectively. It
contains a vision, mission, goal and a set of guiding principles followed by broad policy statements under
Vulnerability, Adaptation, Mitigation, Sustainable Consumption and Production, Knowledge Management
and General Statements. The transport sector strategy is stated as "Taking action to promote integrated
transportation systems, low emission fuels and improved fuel efficiency taking into consideration the long
term sustainability of the existing resources."
Sri Lanka Strategy for Sustainable Development
The Sri Lanka Strategy for Sustainable Development developed by the Ministry in charge of Environment
in 2007 outlined the sustainable development vision, goals, strategies and targets for a thirty-year period,
The strategy document discusses Sri Lanka Transport Board Act No. 22 of 2005, which was enacted to
establish Public Sector Bus System in order to upgrade and to meet the new challenges of competitive
road passenger market. It also proposes ‘fuel diversification in the transport sector' and ‘moving towards
greener urban transportation and clean air' as strategies for the transport sector in Sri Lanka.
The table below summarizes the Sri Lanka's sustainable priorities with respect to its transport sector, based on the policies detailed above:
Priority
Description
Large scale development and introduction of efficient public transport systems
such as BRT, LRT and MRT systems leading to a modal shift from private to
public modes of transportation.
Increased adoption of electric and hybrid vehicles running on alternative fuels
Alternative Vehicles such as electricity, biofuels, etc.
Reduce traffic congestion and air, noise pollution in urban areas especially the
Urban Congestion
CMA through increased adoption of public and alternative modes of
Achieve greater diversity of fuel sources and reduce dependence on imported
sources of fuel especially petroleum.
Reduce GHG emissions from the transport sector through the adoption of
alternative clean fuel vehicles and public modes of transport, decreasing its
reliance on fossil fuels
Table 3: Summary of Sri Lanka Transport Sector Sustainable Priorities
The analysis of the policy environment in Sri Lanka shows that while the necessary policy framework for
the NAMA is present, there is a distinct lack of encouragement and promotion of private sector
participation in the transport sector. Additionally, another key barrier to the implementation of these
policies is a severe lack of sovereign funding at the national and regional level.
The NAMA thus offers a robust mechanism to access international finance to bridge the gap in funding
required for the implementation of these policies while developing a policy environment that encourages
and invites increased private sector participation.
2.6. Stakeholders in the Transport Sector
Given the importance and scale of Sri Lanka's transport sector, there are multiple government
organizations, academic institutions along with numerous private players that play important roles in the
development of the sector. This section details the primary administrative as well as capacity building
bodies that play a significant role in the development of climate change mitigation or sustainable
development policies in the transport sector.
Major Administrative and Implementing Bodies
The following table details the organizations/ministries that are the major players in the Sri Lankan
transport and sustainability/climate change sectors (to be revised based on inputs from MoIT on
structure)
Main Organization
Sub Organization
Role in Sri Lanka
The M/E is responsible for the conservation of Sri Lanka's environment and natural resources. It is also
The Ministry in Charge of
responsible for developing Sri Lanka's national action
Environment
plan on climate change and mitigation, i.e. the Haritha Lanka Programme.
The M/Transport is responsible for the development, implementation and maintenance of Sri Lanka's
transportation sector (including policy formation and development) including road, rail, air and marine transportation.
The SLR is responsible for the development and
Sri Lankan Railways
maintenance of Sri Lanka's railway infrastructure.
The DMT is responsible for the enforcement of rules
Department of Motor
and regulation provided in the Motor Traffic Act
including registration of motor vehicles, licensing of drivers, etc.
This agency is responsible for advising the government
National Transport
Ministry of Internal
on national policy relating to passenger transport
Transport
services by omnibuses (para-transit).
This agency is responsible for advising the government
Sri Lanka Transport
on national policy relating to passenger transport
services by buses.
The RDA is the highway authority in Sri Lanka and is responsible for the maintenance and development of
Road Development
the National Highway Network, comprising the Trunk (A
Class) and Main (B Class) roads including the planning, design and construction of new highways, bridges and expressways to augment the existing network.
The PDA is responsible for the development and
Port Development
maintenance of Sri Lanka's ports and associated
facilities and services.
Main Organization
Sub Organization
Role in Sri Lanka
Air Resource Management
The AirMAC is the main organization responsible for
Center (AirMAC)
ensuring effective air quality management in Sri Lanka.
This ministry is responsible for the governance, implementation, creation and development of Ports
Ministry of Highways, Ports
including Colombo, Galle and Trincomalee ports,
and Shipping
highways including Southern expressway, Colombo Outer Circular expressway, Katunayake expressway and their transport services.
The M/F&P responsible for developing and executing
Ministry of Finance and
the Sri Lanka's public finance policy, economic policy
Planning
and long term planning.
The ministry is responsible for the development of efficient and effective provincial and local administrative
Ministry of Local
Government and Provincial
development. It is also responsible for the promotion of
Councils
decentralized governance models at the local and provincial level.
Ministry of Urban
The M/UD&SAD is responsible for the development and
Development and Sacred
maintenance of the infrastructure of Sri Lanka's urban
Area Development
centers including its major cities like Colombo.
The M/P&E is responsible for the development of the power and energy sector in Sri Lanka. In relation to the
Ministry of Power and
transportation sector, we will need to bring them in for
the development of projects related to clean energy and alternative fuels like bio-diesel.
Urban Development
The UDA is considered to be the principle planner and
Authority
developer of sustainable urban centres in Sri Lanka.
Table 4: Major Administrative & Implementing Bodies
Most transportation projects in Sri Lanka involve multiple organizations/ministries working together,
usually a combination of aforementioned organizations. Apart from these we have also listed a number of
additional administrative and capacity building bodies that we will believe will play an important role in the
implementation of a transportation NAMA in Sri Lanka.
(Climate
Mitigation
Apart from the ministries and organizations mentioned above, the following organizations play an important role in the development of Sri Lanka's climate change mitigation and sustainability policies,
Main Organization
Sub Organization
Role in Sri Lanka
The SEA is responsible for the exploration, facilitation,
Sustainable Energy
research & development and knowledge management
Authority (SEA)
of indigenous energy resources while promoting conservation of existing resources.
The CEA is responsible for the development and
The Ministry in Charge of
Central Environmental
implementation of environmental rules and regulation
Environment
including licensing, laboratory services, GIS/RS services, etc.
Table 5: CC&S Administrative Bodies
Capacity Building Organizations
The following organizations provide effective capacity (administrative and technical) building skills within
Sri Lanka to ensure that the proposed projects can be carried forward indigenously.
Main Organization
Sub Organization
Role in Sri Lanka
The NERDC is responsible for development,
National Engineering
research and transfer of the latest technology in
Research and Development
Sri Lanka inorder to improve and develop
indigenous industries.
The Ceylon German Technical Training Institute
Ceylon German Technical
is responsible for the training of skilled
Ministry of Transportation
Training Institute
engineering and allied trades.
Table 6: Capacity Building Bodies
The list of players provided above serves to highlight the major stakeholders in Sri Lanka's climate change and transportation sectors, whose participation is crucial for the successful implementation of any
project involving these sectors.
Apart from the aforementioned stakeholders the NAMA will also need to involve regional stakeholders as
well as various private players such as bus fleet or para-transit operators. There is also a need to
approach international funding organizations like ADB, JICA and World Bank among others who have a significant presence in the development of Sri Lanka's transportation sector and will play a significant role when it comes to the implementation of the NAMA, especially in the aspect of financing.
3. NAMA Baseline and Targets
3.1. NAMA Objectives
The overarching target of the Sri Lanka NAMA is the promotion and adoption of clean, sustainable and
efficient means of public transportation within the Colombo Metropolitan Area, resulting in a modal shift
from private to public mode of transportation. The NAMA is intended to help Sri Lanka achieve the
following objectives for the transport sector as identified in the National Transport Policy:
Encourage the use of public transport and high occupancy vehicles resulting in a modal shift from
private to public modes of transportation
Encourage the promotion and adoption of new cleaner technologies such as electric or hybrid
vehicles and reduce the environmental (reduce GHG emissions & pollution), economic (reduced
expenditure on fossil fuels) and social (increase in health benefits) impacts of a conventionally
fuelled transport sector
Apart from the objectives highlighted above, the NAMA will also contribute towards the achievement of
numerous additional sustainable development objectives including:
Reduce Sri Lanka's dependence on imported petroleum fuels for the country's mobility
requirements, increasing Sri Lanka's energy security
Provide access to safe, affordable, accessible and sustainable transport systems for all,
especially the vulnerable sections of society, leading to greater development and mobility among
these societies and consequently within Sri Lanka
Creation of new job markets in Sri Lanka, increasing opportunities for skilled labour through the
development of multiple ancillary industries around the development and implementation of the
NAMA intervention
Provide Sri Lanka multiple avenues for transfer of advanced clean technologies from more
developed economies such as China, Europe, etc., opening up opportunities for collaboration,
knowledge transfer and subsequent development of indigenous clean technology industries
Increase private sector participation in the development of Sri Lanka's transport sector. The
private sector is seen as an essential partner in the implementation of the NAMA – either through
public-private partnership enterprises or in sub-contracting relationships with the public sector as
technical consultants, technology suppliers, constructors, operators, etc. Without the private
sector and its commitment to provide co-funding and take risk, implementation of the interventions
would be limited
Achieve additional sustainable development benefits such as improved air quality, increased time
savings and capacity building among others
The following figure summarizes the NAMA targets and objectives:
Figure 8: NAMA Targets & Objectives
All the objectives stated above are intrinsical y tied to chal enges faced by the CMA's transport sector, hampering its growth and development. Thus, in addition to achieving the aforementioned objectives, the
NAMA was developed to help address these challenges. The challenges and the consequent genesis of
the NAMA intervention have been detailed in the following sections.
3.2. Challenges faced by CMA's transport sector
The CMA transport sector faces numerous issues, which have prevented it from being the sustainable,
efficient machine it should be. The primary issues of the CMA as defined by the Urban Transport System
Development Project for Colombo Metropolitan Region and Suburbs can be divided into two broad
Traffic Congestion
An unchecked increase in private traffic over the years has led to increased traffic congestion
within the CMA, especially in the CMC region. This has had several negative effects on the
economic and environmental health of the city due to increased vehicle operating costs, greater
travel time costs and high pollution of regions where congestion is prevalent.
Issues of Public Transport
Each of CMA's mode of public transportation i.e. rail, bus and other road based transport systems is plagued by its own set of individual issues such as insufficient capacity, unregulated fares,
insufficient integration with other modes of transport and lack of enforcement of on road rules and
regulations to name a few that have prevented the CMA from having a cohesive, efficient
transportation network that can meet the growing demands of its people.
Neither of the issues mentioned above are mutually exclusive. An inefficient and under connected
network of public transportation consisting of slow, inefficient buses, low capacity railways and
unregulated assortment of para-transit modes such as three wheelers contributes to a passenger's
dissatisfaction with public modes of transportation, thereby making private modes of transportation more
attractive. This in turn contributes to the critical problem of traffic congestion in the city resulting in longer
travel times for passengers.
Thus, an approach that tackles either one of the aforementioned issues will have a cascading remedial
effect on both of them. While the development of large-scale infrastructure projects such as monorail and
Bus Rapid Transit (BRT) can address issues of level of service, the introduction of electric vehicles into
these public modes of transportation adds significant transformational potential by increasing the direct
emissions reduction potential while promoting the adoption of cleaner, more efficient vehicles within the
transport sector.
3.3. Introduction of electric buses on the planned Bus Rapid
Transit (BRT)
The NAMA development process was initiated with the preparation of a concept note, detailing the
various interventions that are suitable to the Sri Lankan context and could be taken up under the transport
NAMA. Based on GHG reduction potential, sustainable development, transformation potential and
financeability, the following interventions were identified:
Energy Efficiency Measures in Transportation Development of an Integrated Transportation System Development of Transit Oriented Development (TOD) Cities
Following the development of a concept note which provided the frameworks for the aforementioned
interventions, a stakeholder consultation workshop was conducted in Colombo with the purpose of
selecting a final intervention. For the consultation, held with assistance from the Climate Change
Secretariat, representatives from a number of government organizations working in the areas of
environment, climate change and transport in Sri Lanka were invited.
The participants were able to narrow down the list of interventions to two possible interventions that could
be taken up under the transport NAMA viz.:
Development of an Integrated Transportation System (could possibly include Multi-modal
transport hubs, Bus Rapid Transit (BRT), Monorail etc.)
Promoting the adoption of electric vehicles
Based on the conclusions drawn from the stakeholder consultation workshop and subsequent research
and literature review of the state of transportation in Sri Lanka, especially for the capital city of Colombo,
the decision was taken to develop the following final NAMA intervention as the Sri Lankan Transport
Introduce electric buses as replacement for conventionally fuelled buses on the planned
Bus Rapid Transit (BRT) on Galle Road in the Colombo Metropolitan Area (CMA)
While the NAMA will ultimately be scaled upwards and implemented throughout the country, the
observations are based on the study of literature on the capital city of Colombo, which is not only an
integral part of the development and economic fabric of the country but also has the most advanced plans
for urban transport in the country. The NAMA design has therefore been developed based on the issues
highlighted in the Urban Transport Master Plan for the Colombo Metropolitan Area (CMA) as well as the
feasibility study on the implementation of a BRT on Galle Road in the Colombo Metropolitan Area (CMA).
3.4. Alignment of the NAMA Objectives and Targets with
National Strategies and Transformative Change
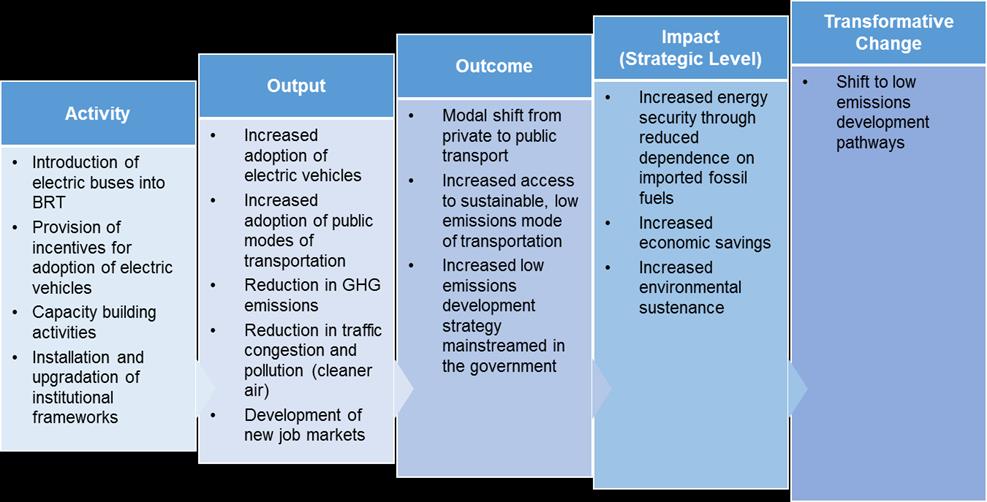
The transformative change implicit in the NAMA can best be seen through the application of a theory of change approach. The theory of change approach "defines al building blocks required to bring about a given long-term goal. This set of connected building blocks - interchangeably referred to as outcomes,
results, accomplishments, or preconditions - is depicted on a map known as a pathway of change/change framework, which is a graphic representation of the change process" (Center for Theory of Change, 2013). Using this approach will help to ensure that the NAMA focuses not just on emissions reductions
but also on achieving sustainable development, national development goals and transformative change.
This approach is also aligned with the Green Climate Fund (GCF) results framework. The overall targets
Figure 9: Theory of Change Approach to NAMA Targets
for the NAMA can be seen in the following figure:
The transformative change must also occur in a fashion which is aligned with Sri Lanka's development
goals while benefiting the region where it is implemented. The regional and national alignment of the NAMA with respect to Sri Lanka's policies and needs for its transport sector has been discussed below.
Benefits for the CMA
This following table provides a brief overview of the specific benefits that the proposed NAMA intervention
offers, thereby making it suitable and appropriate for the CMA region:
Given the distances and frequency of trips that buses on the BRT will be making,
electric buses serve as the perfect medium of transportation providing the same
level of service as conventionally fuelled buses with reduced fuel costs and
subsequently reduced emissions.
This intervention gives an opportunity to leverage tax breaks offered by the
government for the adoption of hybrid and electric vehicles as an additional source
of incentive from the side of the national government. This will also serve to
incentivize greater amount of private participation.
The introduction of newer, more efficient technology into the Sri Lankan
transportation market through large scale adoption of electric vehicles (fleet
adoption) provides demand side incentives for the development of a robust electric
vehicle development and manufacturing industry in and around the CMA, giving rise
to numerous ancillary industries such as manufacturing of batteries, charging
stations, battery recovery and disposal units among others. This will further lead to
the creation of numerous skilled labour opportunities giving rise to a new employment market.
Table 7: Benefits for the CMA
Suitability as a NAMA for the Sri Lankan transport sector
As discussed earlier, actions that result in reduction of greenhouse gas emissions from the baseline
scenario and provide additional sustainable development benefits, if undertaken in a measurable,
reportable and verifiable manner can be considered as NAMAs. They usually revolve around
existing/upcoming regulations, policies, schemes, programmes or strategies in a country that have
significant mitigation and sustainable development potential.
Even though there is an absence of a common standard definition for a NAMA, as per today's
understanding every proposed intervention consists of a number of common elements based on which its
appropriateness as a NAMA for the country is judged. The following elements have been used to judge
the appropriateness of the proposed intervention as a NAMA:
National and Regional Embeddedness GHG Mitigation Potential Transformational Potential Sustainable Development Benefits Financial Feasibility
The following table details the proposed intervention's effectiveness with regards to each of the aforementioned criteria:
Proposed Intervention
Introduce electric buses as replacement for conventionally fuelled buses on the planned Bus Rapid Transit (BRT) on Galle Road
National & Regional Embeddedness
Regional
National
MM-1 5: Multi-modal Transport Hub (MMTH), Multi-
modal Center (MMC) and Park & Ride (P&R)
BT-01: Bus Rapid Transit (BRT)
RL-NT1 5: Monorail
The introduction and utilization of electric vehicles as a national strategy
RD-RN5: Enhancement of Traffic Distribution
also finds mention in the following policy documents:
Urban Transport System
Function of Road Network
Development Project for
National Transport Policy of Sri Lanka
TM-ERP: ERP (Electric Road Pricing) System
Colombo Metropolitan
Environmentally Sustainable Transport in Sri Lanka
Region (CMA) and
RS-1: Education for Road Safety/Tight Control of
Sri Lanka's Second National Communication on Climate Change
Driver's License
The National Climate Change Policy of Sri Lanka
EN-01: Air Emissions Standard for Vehicles
National Action Plan for Haritha Lanka Programme
EN-02: Vehicles Inspection & Maintenance Program
EN-05: Promotion of Hybrid Cars and Electric
GHG Mitigation Potential
The GHG mitigation potential of this intervention is twofold:
The use of electric buses on the BRT in lieu of traditional petrol/diesel vehicles leads to direct GHG emissions reductions. Electric buses are more fuel efficient than their ICE counterparts because of their battery powered electric drive systems which results in reduced fuel consumption. In case renewable energy is used to generate the power charging the batteries of the vehicles, it is possible to achieve additional, significant GHG emissions reductions.
The promotion and increased adoption of public transportation through the BRT decreases the use of low occupancy private vehicles i.e. it creates a modal shift where public transport moves a larger segment of the population in fewer trips compared to the scenario where the same amount of people utilize individual private vehicles. This modal shift generates significant saving in terms of GHG emissions. For example, the Janmarg BRTS in Ahmedabad, India has been able to reduce more than 90,000 tons of CO2 annually (EMBARQ India, 2011).
Transformational Potential
The proposed intervention has the potential to transform the transportation sector for both the CMA and Sri Lanka as a whole in the following manner: •
Developing and implementing a successful BRT in CMA would help increase the adoption of public transportation in the region, making it an attractive proposition for passengers. This increased adoption assists in decreasing the use of private vehicles for transportation within the city which results in a reduction in traffic congestion throughout the region resulting in numerous benefits such as reduced operating costs of vehicles, decrease in pollution, greater fuel savings, lower travel times, etc.
The introduction of newer, more efficient technology into the Sri Lankan transportation market in the form of large scale adoption of electric vehicles (fleet adoption) provides demand side incentives for the development of a robust electric vehicle development and manufacturing industry in and around the CMA.
A sector wide promotion of electric vehicle technology would have significant transformational potential beyond the transportation sector giving rise to numerous ancillary industries such as the manufacturing of batteries, charging stations, battery recovery and disposal units and others.
The success of this intervention in Sri Lanka's economic hub would showcase its viability for the rest of the country, leading to replication in other urban centres within the country increasing the likelihood of the development of a cohesive, sustainable transportation sector throughout the nation.
Sustainable Development Benefits (for the Colombo Metropolitan Area)
Positive
Negative
Decreased traffic congestion – Increased adoption of public transportation
by providing easy access and better quality of service decreases the use of
private vehicles which in turn decreases the traffic congestion faced
throughout the region
Improved air quality – The combination of the use of electric vehicles,
Stress on the electric grid of Sri Lanka – Large scale adoption of electric
increased use of public transportation and decreased traffic congestion leads
buses in BRTs across the country could stress Sri Lanka's electric grid that is
to a reduction in pollution and GHG emissions esp. NOx, SOx and other
already dependent on generation of electricity through fossil fuels to meet the
particulate emissions throughout the CMA
needs of the country.
Quality of employment – Potential to create a lot of the skilled jobs not just
Thus, the design of the NAMA has to ensure that while the adoption of electric
directly through the BRT but through the rise of ancillary industries around the
buses in BRTs is encouraged, it is done so without stressing Sri Lanka's grid
use of electric vehicles
any further wherein their dependence on fossil fuels for the generation of electricity increases.
Human & Institutional capacity - Training of executing agency staff to
monitor, maintain & implement the project
Technology transfer & Technological self-reliance - Use of newer, more
efficient technology that can then be used by Sri Lanka in other similar
projects
Financial Feasibility
While the development of large-scale infrastructure projects such as a BRT can address issues of level of service and has significant potential to transform the sector by inducing a modal shift from private to public transport, their ambition especially in terms of GHG emissions reduction can be significantly increased with the introduction of electric buses as the main mode of transportation.
Further, the Sri Lankan government has shown great interest in pursuing the development of a BRT in the CMA region. However, there is a need for additional financing in order to successfully introduce electric buses to the BRT, replacing more polluting but cheaper conventionally fuelled buses. Thus, the NAMA is envisioned as an innovative project that demonstrates the benefits of using electric buses in place of conventionally fuelled buses as the primary mode of transportation in a Bus Rapid Transit network within the CMA region.
Table 8: Suitability as a NAMA for the Sri Lankan transport sector
3.5. NAMA Baseline Scenario
The baseline is a current or an expected business-as-usual (BAU) scenario. Baselines are defined for the
areas where the NAMA will have high positive impact, such as:
GHG emissions and Sustainable development
The "AMS-III.C: Emission reductions by electric and hybrid vehicles" methodology provided by the
Clean Development Mechanism, was developed specifically for application to project activities that
introduce new electric and/or hybrid vehicles that displace the use of fossil fuel vehicles in passenger and
freight transportation. AMS-III.C was hence found to be most suitable and appropriate to determine the
emissions in the baseline as well as mitigation scenarios of the NAMA.
Baseline of GHG Emissions
The baseline scenario for the NAMA entails the operation of the conventionally fuelled vehicles,
comparable to electric vehicles being operated in the mitigation scenario that would have been used to
provide the same transportation service.
The baseline emissions are calculated based on the unit of service provided by the project vehicles
(diesel fuelled articulated buses) i.e. travelled distance times the emission factor for the baseline vehicle
to provide the same unit of service.
The emission factors included in the CDM methodology AMS-III.C were determined in a conservative
manner through the application of emissions factors gathered from a variety of sources such as
information from data published in public records, research and the Intergovernmental Panel on Climate
As per AMS-III.C, the emission factor of diesel, the fuel consumed by the baseline vehicle is 0.0000726
gCO2/J (IPCC, 2006).
Using the emission factor mentioned above, the baseline GHG emissions for a diesel fuelled two
articulated bus was calculated to be 153.20 tCO2 annually.
Baseline of Sustainable Development Indicators
As discussed earlier, a NAMA consists of actions that not only provide GHG emission reductions but
additional sustainable development benefits as well. Thus, the NAMA will contribute towards the
improvement of several of the sustainable development indicators (Note that environment-related
indicators, such as GHG emission reductions, are not included here).
Quantification of the sustainable development baseline is in most cases more appropriately done on the
local level, in particular in locations where the NAMA intervention is to be implemented. However, if the
overall situation of the focus area of the NAMA is taken into consideration, wherein a BRT does not exist
at the proposed location of the intervention (CMA, Galle Road) or in any other region of Sri Lanka, it is
assumed that the baseline for the NAMA is zero. Therefore the need for and impact of the NAMA
intervention is considered to be high.
The following table provides a brief snapshot of the SD Indicators that are being considered for the NAMA
Indicator
Decrease in air and noise pollution due to reduced
Decreased Pollution
Improvement of health due to a decrease in pollution
and availability of cleaner air
Access to Transportation Increased access to public resources (transport) for the
vulnerable/disadvantaged groups
Job opportunities in the skilled labour segment leading
Quality of Labour
to an increased standard of living
Access to Clean and
technologies, subsequent decrease in costs and
Sustainable Technology
development of domestic industries
Reduced dependence on imported fossil fuels resulting
Increased Energy
in greater energy security as well as cost savings for
Build extensive capacity on both the national and
Capacity Building
regional levels on development and implementation of clean and sustainable projects
Increased private/public sector investments, increased
Asset Accumulation and
cost savings/returns leading to increased accumulation
development of ancillary industries
Increased encouragement and promotion of private
Private Sector Dialogue
sector involvement creating a competitive, thriving
Enhance policy coherence for sustainable development
through the development of robust SD frameworks
Table 9: NAMA Sustainable Development Indicators
As explained earlier, given the absence of a BRT at the NAMA location or any other location within Sri
Lanka, it is not possible to develop a baseline for the SD indicators with respect to the NAMA intervention
for Sri Lankan conditions. Hence, the baseline for the SD indicators is assumed to be zero.
The SD indicators listed in the table above (among others) have been detailed further in Chapter 8 -
NAMA Measurement, Reporting and Verification.
Expected and Targeted Impacts of NAMA Intervention
The values below are used in the following sections for estimation of NAMA impacts on annual GHG
emission reduction over a period of 10 years and achievement of SD indicators listed earlier. The values
are for the replacement of 100 diesel fuelled articulated buses with two door electric buses:
Emissions Reduction
Indicator
Emission reductions per year (tCO2)
Total emissions reductions over a period of 10 years (tCO2)
Sustainable Development
Indicator
Air pollution reduction (ppm)
Number of cases of respiratory health problems
Frequency of eBuses along the BRT
Number of eBuses on the BRT
Capacity building (training/outreach programs held)
Cost savings from increased energy security per bus annually (USD)
Number of private players involved
Table 10: Expected and Targeted Impacts of NAMA Intervention
We will need inputs from the Sri Lankan Government to determine the targeted impacts
(highlighted in yellow).
4. NAMA Technical Intervention
4.1. NAMA Intervention – Promotion and adoption of electric
buses on the Galle Road Bus Rapid Transit (BRT)
Due to the large potential benefits of a well-designed Bus Rapid Transit system as well as the number of
issues it helps to address, the Sri Lankan government has ardently worked towards the development of
the Bus Rapid Transit (BRT) networks as one of their primary modes of climate change mitigation in the
transport sector.
Furthermore, one of the biggest drawbacks of an increase in private vehicle traffic is large increase in
emissions of greenhouse gases (GHG) exacerbating the Sri Lankan transport sector's already large and
ever increasing GHG footprint. The intervention combats this issue by introducing electric vehicles; buses,
as the vehicle of choice to carry passengers on the BRT.
The following table provides an overview of the Galle BRT and the aspects that the intervention will be
Performance Indicator
Baseline Galle BRT (Completely Fossil Fuel Buses)
Average Trip Length
Average km/bus/month
Total km/bus/year
Average number of trips per bus/day
Composition of Buses
Standard Two Door Buses
Articulated Buses
Sri Lanka Transport NAMA - Introduce & Operate Electric Buses in lieu of Articulated Buses
Electric Two Door Buses
Table 11: Galle BRT details with intervention details
The overarching aim of the NAMA is to promote and promulgate the adoption of clean, sustainable
modes of transport in Sri Lanka and while it aims to do so through the introduction of electric buses in the
Galle BRT in place of what would have otherwise been articulated, GHG emitting, diesel fuelled
conventional buses, it does not aim to replace all the conventional modes of transport. This is the reason
why the Galle BRT, through the NAMA, will operate an equal mix of electric and conventionally fuelled
Subsequent sections detail the activities envisaged under the intervention and the eligibility criteria that
an eBus operator needs to meet inorder to qualify for funding under the NAMA.
4.2. An Introduction to Electric Buses
The following sections provides detailed insights into the status of the adoption of electric vehicles
(including buses) around the globe and an overview of the technology that drives them.
A Global Outlook
In today's political and social climate, the global electric bus market is thriving due to growing environmental concerns of the public and various governments. While the high initial cost of electric
buses is a key barrier for this industry, their operational cost is significantly low as compared to that of
conventional buses as electricity is cheaper than diesel. The low fuel cost coupled with unstable crude oil
prices and an increasing focus of transit agencies on minimizing operational costs, is expected to lower
the impact of cost on the adoption of electric buses in the long term. Also, in recent times, investments of
companies and transit agencies are being backed by funding from venture capitalists and governments,
which are, in turn, favouring the growth of the electric bus market.
Studies have shown that electric vehicles result in lower greenhouse gas emissions when compared to
most conventionally fuelled cars in the market (IEA, 2012).
Widespread adoption of electric fleets would also help transform the transportation sector with not just
large scale GHG mitigation but also through the creation of ancillary industries such as the development
and production of energy efficient technologies like batteries that would encourage further GHG
emissions reductions as well as numerous other associated benefits like employment generation and
higher standard of living, among others.
The US-based market research and consulting firm Pike Research forecast in August 2012 that the global
market for all electric-drive buses including hybrid, battery electric and fuel cell buses will grow steadily
over the next six years, with a CAGR (Compound Annual Growth Rate) of 26.4% from 2012 to 2018.
According to Pike, the largest sales volumes will come in Asia Pacific, with more than 15,000 e-buses
likely to be sold in that region in 2018, i.e. 75% of the world total. China will account for the majority of
global e-bus sales, Pike predicts. It believes that growth in the e-bus market will accelerate strongly in
Eastern Europe and Latin America, the latter driven largely by Brazil while sales in Western Europe will
experience steady growth (around a 20% CAGR).
A December 2012 report by the research and consultancy firm IDTechEx forecast that the market for
electric buses and taxis will grow from USD 6.24 billion in 2011 to USD 54 billion in 2021, of which the
largest part will be buses. Thus, with this intervention Sri Lanka is poised to participate in a burgeoning
market that is soon to play a major role in transportation services around the world.
Numerous cities around the world have implemented measures to encourage a shift to electric vehicles
both in the private and public transportation sectors. A few notable examples have been listed below
a. The city of Amsterdam, Netherlands provides subsidies to support companies intending to use
electric cars, taxis and trucks as a key means of transportation around the city. The municipality aims
to increase its population of EVs from 750 (2012) to 10,000 (2015).
b. Since 2012, Berlin, Germany started converting its state-run vehicle fleet to electric and plug-in hybrid
vehicles. Various projects with e-fleets and e-car sharing are underway or are planned, for example:
the Initiative 120 project, a concept for testing alternative drive systems in patrol cars at the Berlin
police department.
c. The city of Kanagawa, Japan provides subsidies, tax breaks and other incentives to reduce initial
user burden and to improve convenience. The national government provides a subsidy equal to 50
percent of the cost differential between an EV and a gasoline vehicle. In addition, K.P.G. tops up the
other half of this subsidy and provides tax relief for automobile tax (for five years) and automobile
acquisition tax by 100 percent.
d. The Chinese government provides national subsidies of 50,000 RMB for plug-in hybrid electric
vehicles and 60,000 RMB for pure electric vehicles. In addition, the City of Shanghai offers 20,000
RMB and 40,000 RMB, respectively. Public service vehicles, such as light duty commercial trucks
and buses, also receive subsidies. Shanghai also maintains a ratio of 1.2-1.5 charging stations for
every electric vehicle. Twenty of these stations have been installed as part of "park and ride" trials.
A Technological Overview
Battery-electric buses are often referred to as "pure" electric buses because the propulsion system is
powered only by the electric energy stored in the battery. The battery pack is either recharged daily or "swapped out" when the batteries are depleted. Due to the potential benefits of using zero emission buses in public fleets, there has been much R&D funding devoted to improving the battery technology
over the last decade.
The most obvious and major benefit of electric drive buses is environmental improvement due to an absence of tail pipe emissions. In an electric vehicle, the impact on the region's environment is dependent only on the power generation process for that region and not on the vehicle itself.
Hybrid electric and plug-in hybrid electric buses are also more fuel efficient than their ICE counterparts
because of their battery powered electric drive systems which results in reduced fuel consumption, as
well as reduced, or even zero, mobile emissions. Electric-drive bus fuel efficiency can be further improved
through a regenerative braking system that captures energy that would otherwise be lost and stores it as
electricity in the on board battery (NREL, 2008). Other advanced technologies such lightweight materials
for body, chassis, and seat assemblies; stop-start systems for idle reduction; improved batteries, electric
motors, converters, and power electronics are also being deployed to further improve the fuel efficiency of
advanced electric buses and thereby further improve the level of service offered by these vehicles as well
as the urban air quality.
Over the years, numerous studies have proved that electric drive buses have significant increases in fuel
economy when compared to standard diesel buses. According to the National Renewable Energy
Laboratory (NREL), hybrid buses offer an average 37% fuel economy improvement over conventional
diesel buses (NREL, 2008).
Currently, active electric buses around the world are segmented into two broad categories:
1. Autonomous Electric Buses
a. Autonomous electric buses are buses where an energy storage device (either a battery or a
flywheel) is located onboard, within the bus itself
b. They can be further categorized into:
Battery Electric Bus – Uses batteries as the storage device Gyrobus – Uses a flywheel as the storage device
Figure 10: Gyrobus
Figure 11: Battery Powered Electric Bus
2. Non-Autonomous Electric Buses
a. Non-autonomous electric buses are powered by electric wires or power lines located outside
the bus, either overhead or located within the roads on which the bus travels
b. They can be further categorized into:
The Trolleybus – The trolleybus utilizes two overhead electric wires, with electricity being
drawn from one wire and returned via the other wire, using two roof-mounted trolley poles
Figure 12: Online Electric Bus (Gapbus)
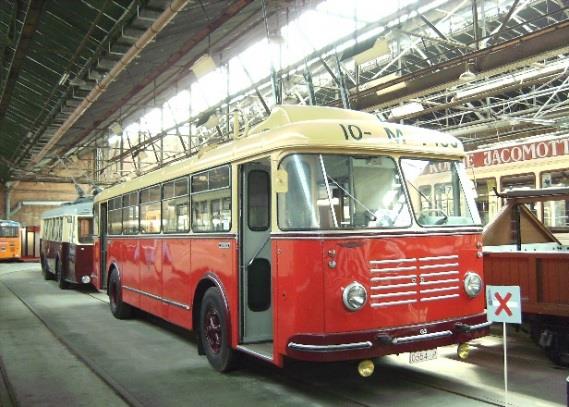
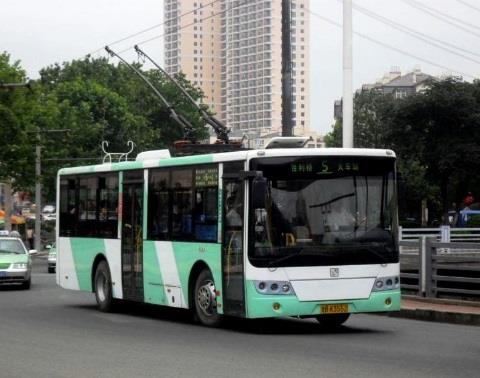
Figure 13: Trolleybus
The Online Electric Vehicle (Bus) – The OLEV (also known as Gapbus) utilizes power
that is supplied over a gap (12 cm to 17 cm) from a power line embedded in the ground
For the Sri Lanka transport NAMA, viable autonomous electric battery powered bus options are proposed.
The drive system for a battery-electric bus consists of an electric motor, a battery pack to provide energy
storage, and a control system that governs the vehicle operation. The battery pack is either recharged daily or "swapped out" when the batteries are depleted. The following table provides an overview of the various components that make up an autonomous electric bus:
Electric Motor
Max. Rated Power: 150 kW (EBUSCO Buses) – 360 kW (BYD Buses)
Battery Pack
Preferred battery of choice in
Lithium Ferrous Phosphate
Energy Density: 110
electric vehicles due to their
Lithium Ion (LiB)
high energy/power densities
and stable chemistry, which
Lithium Manganese Oxide
Energy Density: 280
prevents it from overheating at
high temperatures.
Energy Density: 140
Nickel Metal Hydride (NiMH)
Used in early hybrid/electric
Energy Density: 30 -
Lead Acid Batteries
Mode of Charging
Alternate Current (AC)
Majority of electric drivetrain buses available today are AC charge compatible and are able to charge from 120
or 208/240 Volt AC outlets using an appropriate connector.
Direct Current (DC)
For higher speed charging, DC fast charging equipment is required. Although this technology requires a higher
power utility supply, it is still preferred as it is able to supply DC power directly to the batteries allowing them to
charge at a much faster rate.
The fast charge system can charge a bus with a 40 mile range in roughly 10 minutes. If necessary, the system
can reach at least a 92 percent charge in as little as six minutes.
Table 12: Components of a Battery Powered Electric Bus
Figure 14: Electric Bus Charging Stations
The table below lists out a few prominent manufacturers of the electric buses around the world:
Charging
Performance
Capacity
Technology
(kWh/km)
and-electric-buses.htm &
& Lithium Ferrite
and-electric-buses.htm
Lithium Titanate
tech/product-portfolio/
buses/ebusco-2-0
NA = Not Available
Table 13: Electric Bus Manufacturers
The aforementioned manufacturers among others will be approached to determine the suitability of their buses for the implementation in the
4.3. Activities under the NAMA
As highlighted earlier, the NAMA intervention comprises of the adoption and operation of 100 electric
buses on the Galle BRT in place of conventional diesel fuelled, articulated buses. In this regard, the
activities of the NAMA to achieve the same, are divided into two distinct phases, both of which have been
Pilot (Demonstration) Phase (Phase 1)
Phase 1 of the NAMA intervention will introduce 10 electric buses, owned and operated by private
operators in to the Galle BRT. The aim of Phase 1 of the NAMA, a pilot project, is to generate awareness
about the NAMA, highlighting its importance for the transport sector. Phase 1 also displays the government's commitment to the development of a sustainable transport sector in Sri Lanka while encouraging increased private sector participation through the provision of grants. This should help make
it appealing for other private bus operators in Sri Lanka to operate eBuses on the Galle BRT during full
scale operations of the NAMA.
Apart from the introduction and operation of eBuses on the BRT, Phase 1 shall also include extensive
capacity building measures and awareness programs, designed to fulfil the following purposes:
Training the proponents and participants of the NAMA including training the trainee programs as
well as training of government officials, bus operators and on-ground personnel, among others
Raising awareness about the intervention including information on the technology adopted,
benefits of the intervention, etc. among the Sri Lankan public
The funding for this phase of the NAMA will cover the complete cost of all the 10 eBuses to be introduced
into the BRT, charging stations and capacity building measures. The funding will be sourced from a
combination of sources which includes the private operators of eBuses, the Government of Sri Lanka and
international climate finance.
Full Scale Operations (Phase 2)
Phase 2 will involve the start of full scale operations of the NAMA wherein the remaining 90 eBuses are
introduced and operations of all 100 eBuses commences on the Galle BRT. As with Phase 1, all the
eBuses will be owned and operated by private operators.
Funding for the second phase of the NAMA will cover the difference between the amount pledged by a
private operator for the purchase of an eBus (minimum of 30 percent inorder to be eligible for participation
in Phase 2) and the total cost of the eBus. The NAMA shall also cover the costs of additional charging
stations and capacity building measures (if necessary). The funding for this final phase shall be sourced
from the private operators of eBuses and international climate finance.
Both phases shall also provide free charging for a period of 12 months to all private players operating
eBuses on Galle BRT, starting from the first day of operation.
Figure 15: NAMA Activities
The details of the funding mechanisms for both the phases have been elaborated in Chapter 7 – NAMA
Costs and Finance.
4.4. Eligibility Criteria for NAMA Funding
In order to be able to receive funding under the NAMA, every eBus operator needs to meet the eligibility
criteria set out in the following table:
Eligibility Criterion
Description
Galle BRT, Colombo Metropolitan Area (CMA)
Autonomous electric battery powered bus (check with Sri Lankan
Government if they wish to be specific about the particulars of the
technology like type of battery, minimum battery capacity, mileage,
Minimum Bus Life
Minimum Battery Life
50,000 kms annually (40% of the expected average total distance to be
Minimum Level of Service travelled by a bus on the BRT every year) (check with the Sri Lankan
Government for any additional LoS requirements)
The eBuses must be operational on the Galle BRT within 3 months of
contract award (check with the Sri Lankan Government if the time
period is alright)
The maximum grant funding that can be applied for is a 100
Phase 1 percent of investment costs.
Eligibility Criterion
Description
The maximum funding that can be applied for is equal to 70
percent of the total cost of an eBus. As part of the eligibility
criteria, a private operator needs to pledge atleast 30 percent of
the cost of eBuses inorder to qualify for participation in the
bidding process in Phase 2.
Table 14: Eligibility Criteria for the NAMA
4.5. Approval Structure of the NAMA
The selection of private eBus operators to be financed under the NAMA will carried as per the steps
delineated in the table below:
Description
The NAMA Implementing Entity (NIE) will contact private players who
operate buses in the CMA region, where the Galle BRT will be
interest from private
implemented, through the issuance of an expression of interest
confirming the level of interest in taking part in the introduction and
operation of electric buses on the BRT
The planned implementation of the BRT along with eBuses will be
promoted by the NIE in and around the CMA. Information will be
given to households and institutions about the level of service they
Promotion of electric
can receive and associated costs. Existing companies (for example,
battery manufacturers) and potential operators of ancillary industries
will be informed about the planned intervention and associated costs
such as operational and maintenance costs for an eBus.
Financial bids for permits to operate eBuses on the BRT and access
Invitation of financial
funding for procurement of eBuses, from private operators will be
bids from private
invited. For Phase 1, financial bids for a total of 10 eBuses will be
invited while for phase 2, bids for 90 eBuses will be invited.
Results of financial bids are announced and the name of private bus
operator selected to operate eBuses on the Galle BRT is sent to
NAMA Coordinating Authority (NCA) for approval.
The private bus operator wining the bid shall sign a contract with
Govt. of Sri Lanka (need inputs from the government as to which
ministry/organization should be involved here), committing to a
Contract signing
minimum level of service as by the eligibility criteria to receive
funding. The private player shall now be considered to be an
individual NAMA Executing Entity (NEE).
Description
Payment is released by the NAMA donor to the NCA (also part of the
Release of payment
NIE), who forwards it to the NIE, where from it is released to the
Purchase of eBuses, followed by their operation on the BRT is
Operation of eBus
carried out by the NEE.
Table 15: Approval Structure for the NAMA
The diagram shown below details the workflow of the approval process along with the entities involved.
Figure 16: Workflow of the NAMA Approval Process
5. NAMA Implementation Structure
5.1. Actions to Institutionalize the NAMA
The coordination and management of the NAMA requires an institutional structure, which shall meet the
following requirements:
It must be embedded in national and sectoral policies and strategies. It must be capable of effective communication and reporting as required by international agencies,
such as the UNFCCC.
It must provide an interface to international bilateral and multilateral NAMA funding entities, such
as the Green Climate Fund and NAMA Facility among others.
It must be able to ensure proper management of financial flows between the NAMA funding
entities and the recipients.
It must be able to ensure the achievement of NAMA targets in terms of use of electric vehicles,
GHG mitigation and sustainable co-benefits.
It must be able to allow transparent monitoring of GHG emission reductions and Sustainable
Development indicators.
The recommended institutional structure of the NAMA is based on the following principles:
Ensuring the strong involvement of national stakeholders to create country ownership and political
Using existing and experienced entities organizational systems which are already in place and
allow for prompt and smooth implementation of the NAMA.
Ensuring that the institutional structure is appropriate for the receipt of international private and/or
public donor funding.
5.2. Institutional Framework for NAMA Implementation and
Management
The institutional structure for the NAMA shall include the following institutional bodies at the country level:
a NAMA National Focal Point or National NAMA Approver (NA) a NAMA Coordinating Authority (NCA) a NAMA Implementing Entity (NIE) NAMA Executing Entities (NEEs)
The following sections provide an in-depth understanding of the roles and responsibilities of the
institutional bodies listed above.
National NAMA Approver/Focal Point
The national NAMA Approver or Focal Point shall inter alia:
Approve NAMAs which shall be registered at the UNFCCC
Provide guidance to sectoral NAMA coordinating entities (access to climate finance, financial
flows, MRV etc.)
Issue procedures for accounting of emission reductions to avoid double counting of emission
reductions from various implemented NAMAs
Support the preparation of the National Communication, Biennial Update Reports, and Summary
of GHG Reductions etc.
The Ministry of Mahaweli Development and Environment (check with the Ministry of Env. if this is
the new name for the Ministry of Environment and Natural Resources) has already been appointed
as NAMA Approver/Focal Point to the UNFCCC and as the National Designated Authority (NDA) to the
The NAMA Coordinating Authority (NCA)
The NAMA Coordinating Authority (NCA) is the entity which coordinates the proposed NAMA on
replacement of conventional buses with e-buses. Its main tasks are:
Acting as primary contact for international donor(s) Managing and directing the NAMA Approving NAMA targets The implementation process with regard to the submission of project applications and the
disbursement of funds (in close collaboration with the NCCC, the NAMA Focal Point, the NIE)
Approving and updating eligible interventions Approving annual monitoring reports prepared by the NIE (covering inter alia the number of
projects implemented, the calculation of emission reductions etc.) and
Supervising the financial flows between donors and beneficiaries.
The Ministry of Internal Transport will act as the NAMA Coordinating Authority (NCA) for the Sri Lanka
NAMA Implementing Entity (NIE)
The NIE will be responsible for handling financial flows from funding entities to the beneficiaries as well as
for project approval. The NAMA Implementing Entity (NIE) is the main operative body of the Transport
NAMA in Sri Lanka.
The main tasks of the NIE are to:
Ensure the proper transfer and disbursement of funds from the donors to the recipients based on
an agreed set of criteria (e.g. money will be held in a trust account with limited access, money will
be disbursed only after the project has been implemented, etc.)
Prepare reports to the NCA/donor(s) on various elements of the NAMA, for example:
the use of funds,
the number of projects implemented,
targets achieved
Among other elements
Capacity-building for institutions and companies involved in the implementation of the NAMA (e.g.
micro-grid operators and equipment suppliers)
Development of technical standards for equipment/installations used under the NAMA Co-ordination of promotion and awareness raising campaigns and of support for the
implementation of the NAMA
Integration of the private sector into NAMA implementation Co-ordination of monitoring activities and preparation of monitoring reports for all interventions Facilitation and coordination of verification through the external entity designated for this task Reporting to the NCA in fulfilment of reporting requirements to the donor and Co-operation with internal and external financial auditors
The NIE needs to have a strong background and good track record in financing. Therefore, it makes
sense to recruit external experts to provide support to the NIE on technical financial issues. The
distribution of work between the NIE and the technical experts will be agreed before the start of NAMA
The Ministry of Internal Transport along with the Ministry of Finance and Planning and the
Development Finance Corporation of Ceylon (DFCC Bank) (check with Sri Lankan Government)
shall take up the role of the NIE.
The Ministry of Internal Transportation is responsible for the development, implementation and maintenance of Sri Lanka's transportation sector (including policy formation and development) and hence has an in-depth understanding of the requirements for and barriers to the implementation of the Transport
The Ministry of Internal Transport will be supported by The Ministry of Finance and Planning on matters
related to finance. The Ministry of Finance and Planning is responsible for developing and executing Sri Lanka's public finance policy, economic policy and long term planning and will be essential in providing the technical assistance required in the area of finance such as developing norms and regulations around
the disbursement of the funds.
The Development Finance Corporation of Ceylon (DFCC Bank) will be responsible for disbursing the
funds received from the NAMA donor to the NAMA Executing Entities (NEEs). The DFCC Bank is the
oldest development finance institution (DFI) in Sri Lanka and also the nodal entity for providing loans
related to renewable energy and energy efficiency projects on behalf of the European Investment Bank
(EIB). They thus have extensive experience in the management and disbursement of funds allocated for
the purpose of development in Sri Lanka.
NAMA Executing Entities (NEEs)
The NAMA Executing Entities (NEEs) are the private operators who will operate electric buses under the
auspice of the NAMA. Each NEE will:
Operate electric buses on the proposed Galle BRT in compliance with the rules of the intervention Inform the NIE about the performance of their buses and Collect data for monitoring purposes (requirements will be communicated by the NIE based on the
The existing Sri Lanka Transport Board (SLTB) will act as the supervisory board for the NEEs (As
with every other institution, check with the Sri Lankan Government for approval). The SLTB is
responsible for advising the government on national policy relating to passenger transport services by
buses, providing efficient passenger service by bus throughout the country, maintaining designated bus
terminals and improving services at such terminals for passenger benefit. Thus, they are the most
appropriate organization to supervise the NEEs in the execution of the NAMA.
The following organizational diagram illustrates the recommended institutional structure of the NAMA
described above. The Ministry of Internal Transport will be the core stakeholder in the NAMA due to its
various functions. Bilateral funding entities or donors will be in direct contact with the Ministry of Internal
Transport.
Figure 17: NAMA Institutional Structure
6. NAMA Capacity Development
6.1. NAMA Capacity Development Program
The NAMA capacity development program is designed to ensure a smooth launch of the NAMA and
contribute to the successful implementation of its activities. The development and implementation of the
Sri Lanka Transport NAMA will require capacity building and training of the institutions involved,
government ministries and institutions as well as private bus operators. It will also need the development
of outreach programs inorder to incite interest within the private sector for the NAMA along with
promotional campaigns marketing the intervention (utilization of electric buses in the BRT) to generate
awareness and interest in the adoption and utilization of electric vehicles within the country.
The proposed NAMA capacity development program will consist of two components:
Component 1 will target support for the launch of the NAMA and will provide capacity-building for
the governmental entities involved (such as the NCA and the NIE).
Component 2 will focus on awareness-raising about the NAMA once implementation has begun
and will provide:
General capacity development to create a common awareness of the NAMA
Specific stakeholder oriented capacity building
The capacity development program will be led by international consultant(s) with the support of national
experts. The first component will be carried out by international/national consultants only. In the second
component NCA and NIE staff who have been trained in the first component will start to provide
seminars/trainings and workshops.
6.2. Component 1: Capacity Development for NAMA Launch and
Component 1 of the capacity development program will support the capacity development of institutions
involved for the launch and implementation of the NAMA and will assist in the development of the
following activities:
Establishing a NAMA work flow detailing its processes including implementation cycles, staff
Designing NAMA related contractual conditions (for example, contract for the hiring of an operator
Preparing NAMA project documentation (application forms, call and bid documents, procurement
rules, monitoring, evaluation and reporting forms, etc.)
This component is concerned solely with activities which have to be performed by the NAMA
Coordinating Authority (NCA) and the NAMA Implementing Entity (NIE).
Capacity development for implementation will be carried out by international/national consultants only. In
this regard international experts (technical and financial) will be hired for a period of 3 years, as
international advisors.
The following sections elaborate the various activities of Component 1 of the capacity development
Implementing NAMA network and communication framework
This part of the capacity development program will facilitate establishment of the NAMA entities and
explain the roles that stakeholders will play within the NAMA structures through multilateral and bilateral
meetings and workshops.
During this phase, the NIE will receive assistance through the following types of technical training:
Train the trainer programs about the objectives, benefits and procedures of the NAMA (the NIE
will then be able to offer training to the NEEs)
Case study training for project approval and verification
Training on MRV for GHG emission reductions and SD benefits
Designing designation of authority and time frames for process steps within the NIE
Training on reporting to the NCA
Prepare communication structure and informing procedures detailing the flow of information from
the NA right down to the NEEs and NAMA ground personnel
Regulations and Contractual Conditions
This part of the capacity development program will perform the following roles:
Draft, in close cooperation with the Government, amendments to the existing regulations as
Assist in the drafting of contractual conditions and documents setting out the relationships
between the NAMA stakeholders, as required (e.g. to distribute responsibilities between the
entities constituting the NIE)
The contract to be signed by the NIE and the NEEs will be designed by the NIE (with the support
of the capacity building program) and will contain at least:
Name and address of the legal entity asking for support
A description of the eBuses to be purchased by the NEEs (private operators)
Amount of grant/loan/subsidy to be given
Reference to the legal framework for this NAMA and the relevant approval procedures
The period for finalizing the purchase and operation of eBuses and issuing invoices to the NIE
- Reporting requirements by the NEEs
- Payment conditions
Preparing NAMA project documentation
This activity of the capacity development program involves the following:
Prepare the documents (application forms, call and bid templates, evaluation and reporting forms,
Prepare the procedures for practical implementation (procurement rules, monitoring manual,
evaluation, cross-check, approval and reporting structures, etc.)
Ensure that the relevant forms and procedures are subject to consultation with potential end users
and are sufficiently robust to secure practicability, avoid bureaucracy and eliminate corruption
6.3. Component 2: Awareness Raising and Marketing
Component 2 of the capacity development program will focus on generating interest for the NAMA among
the various stakeholders of the NAMA including private players being invited to participate for the
purchase and operation of eBuses on the BRT (potential NEEs) as well as the Sri Lankan public who will
be utilizing the services provided by the NAMA. This will done through the development of a combination
of awareness raising programs and marketing campaigns, disseminating information on the NAMA
among its various stakeholders.
This component will consist of the following activities:
General activities
A countrywide generic marketing/awareness-raising strategy for the NAMA will create a common
understanding of the benefits of electric buses, their use in the BRT and explain the NAMA's objectives
Organizing NAMA Launch Event
The launch event will be the countrywide kick off for the NAMA and will inform people about its
objectives, stakeholders and timelines. The launch event will include a press briefing and will
provide some informal networking opportunities.
Designing/Maintaining the NAMA Website
The web page is one of the main communication tools of the NAMA providing information about:
The qualification criteria for private bus operators
News and achievements of the NAMA
Coordinating General NAMA Information Events
In addition to the launch event, two general information events (outreach programs) will be
organized per year (for the first three years of the NAMA) which will present the idea of electric
vehicles and this specific NAMA, its objectives and opportunities, and explain the NAMA
Support in Business Development
Focus will be given to supporting new entrepreneurs in developing ancillary industries around the
requirements of the eBus operators and the NAMA. This will include support on technical issues,
such as production techniques, as well as general business development issues, such financing
of production, product selection, client selection and market access.
Preparing/Disseminating NAMA Marketing Material
Typical materials will include leaflets, pens, notepads, a best practice guide, folders, banners, etc.
Cooperation with public and private media
There will be continuous information to the media about the implementation and outcomes of the
Stakeholder-Targeted Activities
These marketing/awareness-raising strategies will help ensure widespread participation in the NAMA.
This section refers to the capacity-building activities, tailored to the needs of the stakeholders, especially
the private bus operators (potential NEEs) and will be provided by international experts.
National NAMA Implementing Entity (NIE)
One of the most important tasks of the NIE with regard to the NAMA is to avoid double counting of
emission reductions and ensure proper monitoring and reporting of the NAMA intervention.
Therefore the NIE's specific capacity-building will focus on:
The exchange of know-how with other countries which are implementing or have implemented
transport NAMAs using electric vehicles
The MRV system of the NAMA
In case of the Sri Lanka Transport NAMA, while the NIE constitutes three separate organizations,
the aforementioned training shall be provided to The Ministry of Internal Transport.
Private Bus Operators
Private bus operators are the companies which will invest in the NAMA (future NEEs) by buying
and operating the eBuses on the BRT as well as providing related services. Workshops and
presentations on NAMA objectives, eligibility, procedures, etc. will be provided to these
Suppliers of EV Equipment (Ancillary Industries)
General information on the NAMA's business potential will be provided to interested companies.
It is estimated that the total cost of the capacity development for the Sri Lanka Transport NAMA will be
approximately around USD 1.2 Million (details provided in Chapter 7 – NAMA Costs and Finance).
7. NAMA Costs and Finance
7.1. Proposed Investment in the Galle Bus Rapid Transit
The "Study of BRT on Galle Road", by the University of Moratuwa has recommended a public-private partnership for the financing of the proposed Galle BRT, with the government of Sri Lanka contributing
upto USD 140 million for the construction and implementation of the BRT, with a majority of the financing being directed towards the development of the BRT's infrastructure components such as bus stations, the run way and traffic components among others. The private sector would be involved through the
purchase of new buses that would operate on the BRT.
The following table indicates proposed investments from the Sri Lankan Government (public investment)
for the various components of the proposed Galle BRT:
Proposed Public Investment
Component
Financing (Million USD)
Planning Stage Cost
Traffic Improvements
Operator Development/Compensation
Urban, Social and Environment Costs
Total Public Contribution
Table 16: Proposed BRT Investments from Sri Lanka Government
It is evident from the information provided in the table above that while the government does not pledge
any finance for the purchase of buses that will run on the BRT, it contributes significantly to the
development of the infrastructure of the Galle BRT. The purchase and operation of buses on the Galle
BRT is expected to be completely under the purview of the private sector.
However, in order to bolster the effectiveness and financial viability of eBuses to private sector bus
operators, it is proposed that the Sri Lankan government contribute financially through the provision of
subsidies to the operators of eBuses on the BRT. The subsidies provided shall be in the form of an import
tax exemption and a fuel subsidy, designed to make the purchase and operation of eBuses on the BRT
attractive for private operators. A financial contribution directly from the local government signifies political
stake and support in the implementation of the NAMA intervention for the BRT, thus strengthening the
commitment to the project.
7.2. Financial Analysis of the NAMA intervention
The proposed NAMA intervention vies to provide an avenue for GHG mitigation and accrue sustainable
development benefits within the CMA through the adoption of eBuses in the Galle BRT, in place of
conventionally fuelled (diesel) buses.
The following table provides an overview of the Sri Lanka Transport NAMA intervention and the costs
associated with its various components:
Performance Indicator
Galle BRT - Baseline Scenario (Conventional Fossil Fuelled Buses)
Articulated Buses
Cost of Individual Bus
Sri Lanka Transport NAMA - Replace Conventional Buses with Electric Buses
Cost of Individual Bus
Cost of Replacement Battery
Charging Stations required
Cost of Charging Station
Table 17: NAMA Costs Overview
Apart from the capital investment required for the purchase of 100 eBuses, the NAMA also includes other
components such as placement of charging stations and capacity building measures.
Utilizing the information presented above, a detailed financial analysis of the intervention was performed,
covering a period of 10 years from the start of the NAMA. The results of this analysis have been
highlighted below:
Indicator
Conventionally Fuelled Buses
Electric Buses
Total Number of Buses
Total Capital Cost
Total Operational Cost
Financial Comparison
Net Present Value (NPV) of Benefits in eBuses
Table 18: Financial Analysis of NAMA
The analysis showcases that the use of eBuses in place of conventionally fuelled buses in the Galle BRT
is a financially viable and lucrative option when compared to the operation of conventional buses, while
also leading to mitigation of GHG emissions and providing various sustainable development benefits for
the CMA. Thus, the development and implementation of the Sri Lanka Transport NAMA provides not just
environmental and social benefits for the country but also yields its operators economic benefits in the
form of early payback and profitability.
Additionally, the financial analysis also details the major cost components of the NAMA that need
financial support (table below) with estimates of the amount of finance required:
Capital Investment
Cost Component
Unit Rate (USD)
Quantity
Cost (USD)
Electric Buses
Cost of eBuses in Phase 1
Cost of eBuses in Phase 2
Charging Stations
Import duty exemption for BRT eBuses
Capacity Development
Cost Component
Unit Rate (USD)
Quantity
Cost (USD)
International Experts
Technical Expert
Financial Expert
International Flights
Awareness Programs
Training programs for BRT staff
Outreach program for private sector
NAMA public awareness raising events
Contingency (5%)
Project Administration (7%)
33,810,520
Table 19: NAMA Costs Details
* Currently 0 as the value for import tax exemption per bus is yet to be decided
The assumptions as well as detailed calculations, along with their respective sources have been
elaborated in the annexures.
7.3. Financing Mechanism for the Sri Lanka Transport NAMA
The financing mechanism for the NAMA has been designed taking into account the various modes of
funding that are available from international financing agencies. The following sections propose a
customized financing mechanism (based on a combination of approaches) that can be utilized based on
the route or scenario through which financing is accessed, i.e. a combination of grants and soft loans.
The table below describes the various approaches on which the mechanism is based:
Approach
Description
A soft loan is a loan, typically given to a developing country, on terms that are very
favourable to the borrower. It usually involves provision of the loan at below-market or
zero rate of interest.
International financing agencies usually prefer providing soft loans when it comes to
infrastructure projects or projects that require a large amount of financing. Since the
transport NAMA could be considered to be an infrastructure project it is likely that
financing agencies would offer soft loans for its implementation.
In reverse auctioning, proposals are collected on the basis of tendering or an eligibility
criteria. Proposals are subsequently accepted based on the amount of funding
requested, with preference given to the lowest technically competent offer.
In case of the transport NAMA, proposals from private operators, in order to access
NAMA financing to purchase eBuses shall be accepted on the basis of the least amount
of funding (gap funding) requested.
An import duty is a tax collected on imports and some exports by the customs authorities
of a country. This tax is used to raise state revenue and is based on the value of goods
called ad valorem duty or the weight, dimensions, or other criteria of the item such as its
size. It is also referred to as customs duty, tariff, import tax and tariff.
In case of the transport NAMA, it is proposed that the Sri Lankan government relax
taxation of electric buses meant for the BRT in the form of exemption from import duties
on the same (indirect subsidy).
A fuel subsidy is a discount on the selling price of fuel as compared to its market value.
In case of the transport NAMA, it is proposed that the Sri Lankan government provide
operators of eBuses fuel subsidy for the first twelve months (one year) of operation in the
form of free charging (direct subsidy).
Table 20: Financial Approaches Utilized
7.4. NAMA financing through a combination of grants and soft loans
The financing mechanism proposed in this section is based on the recommendation that all of the international climate financing required for the
NAMA be availed in the form of grants and soft loans with support from the Sri Lanka government in the form of a grant and indirect subsidies
(import duty exemption).
The following table highlights the various components of NAMA finance, their corresponding financing requirements along with their respective
proposed fulfilment mechanisms:
Investment
Cost Component
No. of Units
Total Cost
Financing Source
Financing Mechanism
Category
Phase 1: Pilot Phase - Introduction of 10 eBuses
Finance for eBuses
Charging Stations
Free Charging (12 Months)
Import duty exemption for BRT eBuses
Indirect Subsidy
International Experts
International Flights
Awareness Programs
Project Administration
Total Cost for Phase 1
5,076,880#
Phase 2: Full Scale Operations - Operations of 100 eBuses
Finance for eBuses
Soft Loan + Reverse
Charging Stations
Free Charging (12 Months)
Import duty exemption for BRT eBuses
Indirect Subsidy
International Experts
International Flights
Awareness Programs
Project Administration
Total Cost for Phase 2
28,733,640#
Total NAMA Cost
33,810,520#
Table 21: NAMA Intervention Financing
* Currently 0 as the value for import tax exemption per bus is yet to be decided based on discussions with the Government of Sri Lanka
# The total values are liable to change depending on the value of import tax exemption that is finally decided upon by the Government of Sri Lanka
The following figure highlights the financial flows for the different financing components within the two phases of the NAMA:
Figure 18: NAMA Financial Flows
Phase 1 - NAMA Pilot (Demonstration)
Phase 1 introduces 10 electric buses through private operators in to the Galle BRT, a pilot project whose
aim is to generate awareness about the NAMA, highlighting its importance for the transport sector.
Funding for eBuses being introduced in Phase 1 will cover the complete cost of the 10 eBuses that the
government wishes to introduce into the BRT, i.e. USD 395,000 per bus (USD 3.95 million for 10 buses),
and shall be covered by international climate financing agencies in the form of grants. This should help
make it appealing for other private bus operators in Sri Lanka to operate eBuses on the Galle BRT during
full scale operations of the NAMA (while also raising awareness about the technology among the Sri
Furthermore, the design parameters for the disbursement of aforementioned funds are as follows:
Funding for the lowest bidder (Reverse Auctioning)
Financial bids for the 10 eBus permits from private operators will be invited. The funds allotted to
the permit will be provided to the operator with the lowest bid, i.e. the lowest amount of funding
requested (reverse auctioning).
Disbursement of funds
The funding allotted to every eBus permit will be sourced in the following manner:
i. The complete amount requested (winning bid) shall be provided from funds availed through
the international climate financing agency.
ii. The remaining unused amount (if any) shall be utilized for the next phase of the NAMA
iii. For example, in case a winning bid requests for USD 295,000 for an eBus, USD 295,000 shall
be fulfilled by the grant from the international climate financing agency while the remaining USD 100,000 shal be channel ed into Phase 2 of the NAMA intervention i.e. the NAMA's full scale operations.
Phase 2 - Full Scale Operations of the NAMA
Phase 2 of the NAMA involves the initiation of the NAMA's full scale operations wherein the remaining 90 eBuses are introduced and operated on the Galle BRT. The financing for phase 2 shall cover the entire
differential cost of the 90 buses open to the private sector, i.e. a value of USD 24.9 Million.
This differential amount shall be availed through international climate finance in the form of a soft loan, at
a low, preferential rate of interest. The NIE will then disburse this amount in the form of soft loans to the
private operators at a very favourable rate of interest, lower than the prevalent market rate.
Thus, while the operators are indebted to return the financing received back to the government, they do
so at a rate which is far lower than the prevalent market rate of return, making the government soft loan
an attractive vehicle to finance the purchase of eBuses.
The disbursement of the loans shall be done on the basis of the lowest bids (reverse auctioning) and it is
likely that not all the amount will be disbursed. The remainder could be channelled into other similar
projects across Sri Lanka or can even be used in the operation and maintenance of the Galle BRT, with
lending being carried out at possibly higher rates than which it was received, thereby acting as an
additional revenue generating source for the government.
The design parameters for the financing of Phase 2 have been elaborated below:
Invitation to bid
Financial bids from an operator will be invited, if and only if, the aforementioned operator has
committed to investing atleast 30% of the capital cost required for the purchase of an eBus in the
form of equity. The remaining amount of the capital cost can be covered by the operator through
the soft loan (received at a rate of interest far lower than prevailing market rates, thus making it a
very attractive option) from the NIE.
Funding for the lowest bidder
The electric bus permits and the subsequent funds allotted to the permit will be provided to the
operator (making it a NEE) with the lowest bid, i.e. the lowest amount of funds requested (reverse
Disbursement of funds
i. Prior to disbursement, the NIE and NEE will enter into a Fund Securitization Agreement (as
agreed upon by the Government of Sri Lanka) providing the NIE claim over the asset, i.e. the
eBus (or eBuses) owned by the NEE, in case of an event of loan default or failure to meet the
required level of service during operation of the eBus on the BRT.
ii. The funding allotted to the NEE will be released in full at the time of purchase of the eBuses
Seizure of assets
In the event that a NEE:
i. Defaults on the loan
ii. Fails to operate an eBus for a minimum of atleast 50,000 kms (approximately 40% of the
expected average total distance to be travelled by a bus on the BRT every year) in a year
iii. Performs a sale of an eBus before the end of its expected life time i.e. 10 years
The NIE holds the right to seize the asset (eBus). The NIE can then resell the eBus to a new
buyer at a lower cost than market cost, on the condition that the eBus continues its operation on
the Galle BRT till the end of its remaining lifespan.
Phase 1 & 2 - Provision of import tax exemption (indirect subsidy),
fuel subsidy (direct subsidy), financing of charging infrastructure
and capacity building
Financing for the following cost components shall also be provided through a combination of government
intervention and international climate finance grants:
Exemption of import duty on eBuses
Apart from the grant funding proposed, it is proposed that the government relax taxation of
eBuses meant for the BRT in the form of exemption from import duties on the same. This will act
as further proof of the government's commitment to the development of a BRT with electric buses
and sustainable transport in Sri Lanka, while making adoption of eBuses in the BRT attractive for
the private sector.
Fuel subsidy through free charging facility
In addition to the exemption of import duty on eBuses, it is proposed that the government provide
operators of eBuses fuel subsidy for the first twelve months (one year) of operation in the form of
free charging. It has been estimated that the fuel subsidy for 100 eBuses for a period of one year
would cost the government a total of USD 1.36 million.
Charging station infrastructure & capacity building
i. Purchasing and setting up 50 charging stations for the electric bus fleet, each costing
approximately USD 50,000 (infrastructure development),
ii. Capacity development and training for the NAMA, to a tune of approximately USD 1.2 million
(details provided above).
Shall be availed through grants from international climate financing agencies
The operations and maintenance costs (including cost of replacement batteries) for the eBuses are
expected to be covered by the revenue generated by the respective players through the operation of
the eBuses on the Galle BRT.
8. NAMA Measurement, Reporting
and Verification
8.1. NAMA Measurement, Reporting and Verification Framework
As a NAMA is an instrument of output based aid, the results of implemented NAMAs need to be
amenable to Measurement, Reporting and Verification (MRV) in order to attract donors and to guarantee
the sustainable success of the interventions.
The methodology for monitoring the effects of NAMAs needs to follow the general principles of
transparency, consistency, comparability, completeness and accuracy. This applies to all the components
to be monitored. The objective of the MRV framework is to provide a credible and transparent approach
for quantifying and reporting GHG emission reductions.
An MRV framework includes the following elements:
System boundary definition
The system boundary encompasses significant anthropogenic GHG emissions by sources under
the control of the project participant that are reasonably attributable to the NAMA intervention as a
project activity.
Baseline scenario
The baseline scenario is the scenario for a project activity that reasonably represents the
anthropogenic emissions by GHG sources as well as sustainable development that would occur in
the absence of the proposed project activity, i.e. the NAMA intervention. In case of the Sri Lanka
Transport NAMA, the baseline scenario constitutes the use of conventionally fuelled (diesel)
articulated buses on the Galle BRT.
Project activity scenario
The project activity scenario is a NAMA intervention, in this instance the utilization of electric
buses on the Galle BRT, and the related anthropogenic emissions by GHG sources and the
associated sustainable development that occurs due to the project activity.
Emissions reduction calculation
The GHG emissions reduction achieved by the project activity will be determined as the difference
between the baseline emissions and the project emissions.
Monitoring
Defines the parameters to be monitored.
Reporting and verification
Defines the reporting requirements and verification procedures.
8.2. Measurement
Monitoring
Emissions
Reductions
The GHG emission reductions which will be achieved by the NAMA intervention, adoption of electric
buses in the BRT, are calculated by comparing project emissions with the emissions under a baseline
scenario. The MRV, including GHG emission calculation and details on the methodology used, for the
NAMA intervention are given in detail in the next section.
Baseline and Project GHG Emissions – An Overview
The Clean Development Mechanism provides the methodology, "AMS-III.C: Emission reductions by
electric and hybrid vehicles", to apply to project activities that introduce new electric and/or hybrid
vehicles that displace the use of fossil fuel vehicles in passenger and freight transportation. This
methodology was found to be most suitable and appropriate to determine the emissions in baseline as
well as NAMA scenario.
System Boundary
The project activity is defined by the use of electric buses on the Galle BRT, thus the project boundary
encompasses the electric buses, the BRT and the source of electricity generation (fuel for eBuses).
Baseline Emissions (Diesel Fuelled Articulated Buses)
The baseline emissions are calculated based on the unit of service provided by the project vehicles
(travelled distance, kms) times the emission factor for the baseline vehicle to provide the same unit of
service as per the equation below:
BEy = EFBL,km x DDy x Ny x 10-6
Parameter
Description
Total baseline emissions in the year y
Emission factor for baseline vehicle
Annual average distance travelled by project vehicle in the year y
Number of operational project vehicles in the year y. In case of the Sri
Lanka Transport NAMA this number is a 100.
Table 22: Baseline Emissions
Using the formulae presented above, the total GHG emissions from 100 diesel fuelled articulated buses
operating on the Galle BRT was calculated to be 15,320 tCO2 annually.
The emission factor for baseline vehicles (EFBL,km) is determined as follows:
EFBL,km = SFC x NCVBL x EFBL x IRt
Parameter
Description
Specific fuel consumption of baseline vehicle
Net calorific value of fossil fuel consumed by baseline vehicle
Emission factor of fossil fuel consumed by baseline vehicle
Technology improvement factor for baseline vehicle in year t. The
improvement rate is applied to each calendar year. The default value
of the technology improvement factor for the baseline vehicle was
assumed to be 0.
Year counter for the annual improvement (dependent on age of data
per vehicle category)
Table 23: Baseline Emission Factor
The assumptions as well as detailed calculations, along with their respective sources have been
elaborated in the annexures.
Project Emissions (Electric Buses)
Project emissions include emissions from the electricity (fossil fuel consumed for generation of electricity)
associated with the operation of project vehicles and shall be calculated as follows:
PEy = EFPJ,km,y x DDy x Ny
Parameter
Description
Total project emissions in the year y
Emission factor per kilometre travelled by project vehicle
Annual average distance travelled by project vehicle in the year y
Number of operational project vehicles in the year y. In case of the Sri
Lanka Transport NAMA this number is a 100.
Table 24: Project Emissions
Using the formulae presented above, the total GHG emissions from 100 electric buses operating on the
Galle BRT was calculated to be 11,604 tCO2 annually.
The emission factor for project vehicles (EFPJ,km,y) is determined as follows:
EFPJ,km,y = SECPJ,km,y x EFelec,y/(1 - TDLy) x 10-3
Parameter
Description
Specific electricity consumption by the project vehicle per km in year y
in urban conditions
CO2 emission factor of electricity consumed by project vehicle in year
Average technical transmission and distribution losses for providing
electricity in the year y
Table 25: Project Emission Factor
The assumptions as well as detailed calculations, along with their respective sources have been
elaborated in the annexures.
Emissions Reduction
Emissions reduction is the difference between the baseline emissions and project emissions after
implementing the NAMA intervention of adopting and operating eBuses on the Galle BRT. Therefore, the
emissions reduction is calculated as follows:
ERy = BEy – PEy – LEy
Parameter
Description
Emission reductions in year y
Baseline emission in year y
Project emission in year y
Leakage emission in year y
Table 26: Emissions Reduction
Since the project activity does not involve any fossil fuel switching measures, leakage calculation is not required and hence "Leakage emission" is taken to be 0.
Thus, the emissions reduction due to the NAMA intervention (100 buses) is calculated to be a total of
3,715.9 tCO2 annually or 37,159 tCO2 over a period of 10 years.
This represents a total of approximately 24% decrease in emissions with respect to the baseline over a
period of 10 years. With an increase in scope and scale of the project, one can expect the emission
reductions to increase further.
Measurement and Monitoring
The following parameters will be monitored for the Sri Lanka transport NAMA:
Parameter
Description
Data Unit
Annual average distance driven by project vehicle
Specific electricity consumed per km per project vehicle
CO2 emission factor of electricity used by project vehicle
Number of project vehicles in operation
Table 27: Monitored Emission Parameters
The aforementioned parameters are detailed below:
DD (Annual average distance driven by project vehicle)
Parameter
Data Unit
Description
Annual average distance driven by project vehicle
Source of Data
Frequency
Measurement
Monitor the distance travelled by all project vehicles
Procedure
SEC (Specific electricity consumed per km per project vehicle)
Parameter
Data Unit
Description
Specific electricity consumed per km per project vehicle
Source of Data
Frequency
Measurement
Monitor electricity consumption of all project vehicles
Procedure
EF (CO2 emission factor of electricity used by project vehicle)
Parameter
Data Unit
Description
CO2 emission factor of electricity used by project vehicle
Source of Data
Frequency
Through international publications such as IPCC Guidelines for National
Measurement
Greenhouse Gas Inventories as well as national energy data sources like
Procedure
Ceylon Petroleum Corporation
N (Number of project vehicles in operation)
Parameter
Data Unit
Description
Number of project vehicles in operation
Source of Data
Frequency
Measurement
Operational contract between the private bus operator (NEE) and the NAMA
Procedure
implementer (NIE)
Table 28: Monitored Emission Parameters Details
8.3. Measurement and Reporting of Sustainable Development
Benefits
In addition to GHG emissions, the MRV system for this NAMA will monitor the impact of the NAMA
interventions on selected Sustainable Development (SD) indicators.
The selection of the SD indicators was done using the Sustainable Development Evaluation Tool (SD
Tool) developed by UNDP. The tool divides the SD indicators into five different domains: environment;
social; growth and development; economic and institutional.
The tool requires that for each intervention that an indicator (such as air pollution, biodiversity, health,
etc.) is selected. The impact of the intervention on the chosen indicator can then be identified and
explained, and the effects (positive, negative or both) pinpointed.
Sustainable Development Benefits of the Sri Lanka Transport
NAMA
The indicators selected for the NAMA, in each of the five SD domains, are as follows:
Parameter
Data Unit
Number of cases of respiratory health problems
Frequency of eBuses along the BRT
Number of eBuses on the BRT
Capacity building (training/outreach programs held)
Cost savings from increased energy security annually
Number of private operators involved
Table 29: Monitored SD Parameters
Given the absence of a BRT prior to the development of the NAMA, the baseline values for most of the
parameters listed above can be safely assumed to be zero. However, parameters such as air pollution
and cases of respiratory health problems have existed even before the development of the BRT and have
accordingly been taken into account.
Baseline
Parameter
Data Unit
Cases of respiratory health diseases
Frequency of eBuses along the BRT
Number of eBuses on the BRT
Capacity building
Cost savings from increased energy security
Private operators involved
Table 30: SD Parameters Baseline and Project Values
We will require inputs from the Sri Lankan government for the parameters highlighted in yellow.
Measurement and Monitoring
The SD benefits achieved due to the NAMA needs to be measured continuously, and reported by the
responsible entity/intervention implementer regularly. Hard or soft copies of the reports should be kept at
a safe centralized point, and be archived.
The SD parameters have been detailed below:
Air Pollution
Parameter
Concentration of air pollutants in the atmosphere
Data Unit
The amount of pollutants in the atmosphere including SOx, NOx and
Description
particulates, measured in parts per million (ppm)
Source of Data
Frequency
Measurement
Monitor the concentration of pollutants in the atmosphere in and around the
Procedure
Respiratory Health Diseases
Parameter
Number of cases of respiratory health diseases
Data Unit
Number of cases of respiratory health disease reported in the vicinity of the
Description
BRT since the implementation of the NAMA
Source of Data
Hospital Records
Frequency
Monitor records of hospitals located in and around the vicinity of the BRT for
Measurement
cases of respiratory health diseases and survey undertaken in cooperation
Procedure
with the local community
Frequency of eBuses along the BRT
Parameter
Frequency of eBuses
Data Unit
Description
Number of eBuses available at every stop of the BRT every hour
Source of Data
NAMA implementer's records
Frequency
Measurement
Monitor the number of eBuses stopping at bus stops every hour
Procedure
Number of eBuses on the BRT
Parameter
Number of eBuses on the BRT
Data Unit
Description
Number of eBuses operational on the BRT
Source of Data
NAMA implementer's records
Frequency
Measurement
NAMA implementer's records on the operational contracts signed between the
Procedure
private bus operator (NEE) and the NAMA implementer (NIE)
Capacity building
Parameter
Number of events/programs held to train relevant NAMA stakeholders
Data Unit
Number of training/outreach/awareness programs/events held to train/raise
Description
awareness of relevant NAMA stakeholders including NIE, NEEs and the
Source of Data
NAMA implementer's records
Frequency
Measurement
Procedure
Cost savings
Parameter
Cost savings from increased energy security
Data Unit
Amount of financial savings accrued due to a decrease in the use of imported
Description
conventional fuels for the operation of eBuses on the BRT
Source of Data
NAMA executing entities' and NAMA implementer's records
Frequency
Measurement
Comparison between operational costs of eBuses and conventional buses
Procedure
operating on the BRT
Jobs created
Parameter
Number of new jobs created
Data Unit
Description
Number of new jobs created due to the implementation of the NAMA
Source of Data
NAMA implementer's records
Frequency
NAMA implementer´s records on number of new employees generated
Measurement
internally within institution and reports on numbers of new employees from
Procedure
intervention implementers and other relevant stakeholders
Private operators involved
Parameter
Number of private operators operating on eBuses on the BRT
Data Unit
Private Operators
Number of private operators operating on eBuses on the BRT indicating a
Description
policy environment encouraging private sector involvement
Source of Data
NAMA implementer's records
Frequency
Measurement
NAMA implementer's records on the operational contracts signed between the
Procedure
private bus operator (NEE) and the NAMA implementer (NIE)
Table 31: Monitored Emission Parameters Details
Details of the SD indicators chosen for the Sri Lanka Transport NAMA have been provided in the
8.4. Measurement and Reporting of NAMA Support
The support provided as part of the NAMA will also need to be measured. While support can be provided
in many forms: capacity-building, technology transfer and financial, since the bulk of support will come in
the form of financing, it is the financial support which will be measured.
International Finance
Parameter
International Financial Support
Data Unit
Description
The amount of international financial support spent per activity
Source of Data
NAMA implementer's (NIE) records
Frequency
Measurement
All finances disbursed need to be tracked as per the standard governmental
Procedure
tracking procedures.
National Finance
Parameter
National (Government) Financial Support
Data Unit
Description
The amount of national financial support (i.e. subsidies) spent per activity
Source of Data
NAMA implementer's (NIE) records
Frequency
Measurement
All finances disbursed need to be tracked as per the standard governmental
Procedure
tracking procedures.
Table 32: Monitored NAMA Support Parameters
8.5. Monitoring, Reporting and Verification (MRV) Management
Framework
The main responsibility of the MRV system lies with the NAMA implementing agency i.e. the NIE. The
database and the compliance system will be set up by the NIE. The NIE may however delegate some of
the tasks to the organizations operating the intervention, i.e. the NEEs.
The process flow for the MRV management framework is as follows:
The monitoring agency, which in case of the Sri Lanka Transport NAMA are the NEEs, will collect
the data according to the monitoring plan (as part of their approved application), ensuring they
fulfil all related requirements such as record keeping and quality control.
The NEEs report the monitoring results to the NIE in an annual report.
The NIE collects all monitoring reports, combines them in a central monitoring database and
summarizes the results in a NAMA monitoring report. This report contains information on GHG
emission reductions, progress in the SD indicators, and the financial performance of the NAMA
The report is then forwarded to the NCA, who then checks and approves the annual monitoring
The NIE also arranges for an external verification entity to verify the annual monitoring report.
The final monitoring report together with the verification report of the external verifier is submitted
to the NAMA donor(s).
Figure 19: NAMA MRV Management Process Flow
The following figure illustrates the management flow as described above:
8.6. Reporting Forms
The NAMA Coordinating Authority (NCA) is responsible for the development of reporting form templates.
These forms will include at a minimum the following information:
Details of the technology used
Details of the NEE, including contact details
Description of the measuring system
Data parameters measured
Default values applied
Sampling plan details
Calculation of emissions reductions
The reporting form template will be provided by the NCA to the NEEs. The completed forms will be
submitted annually to the NIE by the NEEs.
8.7. Verification Mechanisms
Verification rules for NAMAs are usually based on the requirements of the NAMA funding agencies, as
well as host country requirements. Before developing domestic capacity for verification, it is
recommended to use some of the existing CDM Designated Operational Entities (DOEs) or ISO 14064
certification bodies with experience in the transport sector and a good understanding of local conditions in
the Sri Lanka, but NAMA-specific verification rules should be developed in the future.
The goal of verification is to have an independent third party auditor ensure that the NAMA is operating as
planned and that the measuring and reporting system is being implemented as planned. The verification
also ensures that emissions reductions and SD benefits are real and measurable.
9. NAMA Implementation Plan
9.1. NAMA Implementation Flow
The implementation of the NAMA will be carried out in three main steps. As a first step, the institutional
structure for NAMA implementation proposed in this document needs to be established. In parallel,
funding from both international and national sources needs to be secured. Once these two steps are
finalized, implementation of the NAMA intervention can proceed.
Figure 20: NAMA Implementation Flow
9.2. Establishing NAMA Institutional Structure
As mentioned earlier, the first step of the NAMA implementation involves the establishment of the
institutional structure proposed in this document. This would involve the following steps:
Finalizing NAMA implementation structure
This involves the final assignment of roles within the NAMA implementation structure, such as NAMA
Coordinating Authority
(NCA) and NAMA Implementing Entity (NIE) to the various
organizations/ministries as proposed in Chapter 5 – NAMA Implementation Structure.
Assignment of tasks and responsibilities
Once the roles have been assigned, jurisdictions along with associated tasks and responsibilities of
each of the NAMA implementation entities need to be defined and convened to the concerned entity.
These tasks and responsibilities have been detailed in Chapter 5 – NAMA Implementation Structure.
Establish reporting structure
Apart from defining roles and responsibilities, there is also a need to clearly define the reporting
structure of the NAMA implementation structure, along with its associated process flows. These too
have been detailed in Chapter 5 – NAMA Implementation Structure.
The benefit of the proposed structure is that all players (government ministries and financial institutions)
already exist and no new body needs to be created.
9.3. Securing International and National Funding
Early stage consultations with international climate financing agencies are essential for securing sufficient
international donor funding. Informal distribution of information on the NAMA concept should start
immediately, in a bid to generate interest in the country, the NAMA and the sector in which the NAMA is
being developed for. Formal approaches to potential funding agencies should start as soon as the NAMA
document is finalized.
Potential donors that already actively fund NAMAs are the German and British governments through the
NAMA support facility, Global Environmental Facility (GEF) through its executing agencies, the Green
Climate Fund (GCF), other EU Governments, and Japan through the Japan International Cooperation
A secured budget for the domestically funded component will provide a strong signal to potential
international financing agencies of a commitment to NAMA implementation by the Sri Lankan government.
Therefore, it is essential that the domestic contributions to the interventions (subsidies in the form of
import tax exemption and free charging) are secured within the state budget.
9.4. Implementation of NAMA Intervention
Once the institutional structure is in place and funding (both national and international) is secured, implementation of the intervention can start. The process of
implementation will be as described in detail in Chapter 4 – NAMA Technical Intervention (Sections 4.3, 4.4 and 4.5) and Chapter 7 – NAMA Costs and Finance
(Section 7.4). The following table gives a summary of the implementation timeline:
Activity
Pre NAMA Intervention Implementation
Establishing NAMA institutional structure
Securing international and national funding
NAMA Intervention Implementation
Confirmation of interest from private bus
operators
Raising awareness of NAMA and promotion
of electric buses
Phase 1: NAMA Pilot Phase (10 eBuses)
Invitation of financial bids from private
operators
Announcement of results of bids
Contract Signing
Release of payment
Purchase and operation of 10 eBuses
Phase 2: Full Scale Operations (100 eBuses)
Invitation of financial bids from private
operators
Activity
Announcement of results of bids
Contract Signing
Release of payment
Purchase and operation of 90 new eBuses
(total of 100 eBuses operational)
Table 33: Sri Lanka Transport NAMA Implementation Timeline
References
Asian Development Bank (ADB), 2012. The Asian Development Bank's Support for the Transport Sector
in Sri Lanka. Available from http://www.oecd.org/derec/50582596.pdf
Asian Development Bank (ADB), 2015. Sri Lanka: Economy. Available from
Center for the Theory of Change, 2013. What is Theory of Change? Available from http://www.
EMBARQ India, 2011. Buses as Low Carbon Mobility Solutions for Urban India: Evidence from Two
Cities. Available from
GIZ TUEWAS NAMA Working Group (in collaboration with the UNEP DTU Partnership) (GIZ/UNEP),
2014. How are INDCs and NAMAs linked? A discussion paper on the links between INDCs, NAMAs and
Government of Sri Lanka Department of Census and Statistics, 2008. MDG Indicators of Sri Lanka –
A Mid Term Review 2008. Available from http://www.statistics.gov.lk/MDG/Mid-term.pdf
Government of Sri Lanka Department of Census and Statistics, 2012. Census of Population and
Housing 2012. Available from
Government of Sri Lanka Department of Census and Statistics, 2013. National Accounts of Sri Lanka
2012. Available from
Government of Sri Lanka Ministry of Environment, 2011. Sri Lanka's Second National Communication
on Climate Change. Available from http://unfccc.int/national_reports/non-annex_i_natcom/items/2979.php
International Energy Agency (IEA), 2012. EV City Casebook: A Look at the Global Electric Vehicle
Intergovernmental Panel on Climate Change (IPCC), 2014. Sims R., R. Schaeffer, F. Creutzig, X. Cruz-
Núñez, M. D'Agosto, D. Dimitriu, M. J. Figueroa Meza, L. Fulton, S. Kobayashi, O. Lah, A. McKinnon, P.
Newman, M. Ouyang, J. J. Schauer, D. Sperling, and G. Tiwari, 2014: Transport. In: Climate Change
2014: Mitigation of Climate Change. Contribution of Working Group III to the Fifth Assessment Report of
the Intergovernmental Panel on Climate Change [Edenhofer, O., R. Pichs-Madruga, Y. Sokona, E.
Farahani, S. Kadner, K. Seyboth, A. Adler, I. Baum, S. Brunner, P. Eickemeier, B. Kriemann, J.
Savolainen, S. Schlömer, C. von Stechow, T. Zwickel and J.C. Minx (eds.)]. Cambridge University Press,
Cambridge, United Kingdom and New York, NY, USA.
National Renewable Energy Laboratory (NREL), 2008. Robb A. Barnitt: In-Use Performance
Comparison of Hybrid Electric, CNG, and Diesel Buses at New York City Transit. Available from
United Nations, 2015. Millennium Development Goals Country Report 2014 – Sri Lanka. Available from
University of Moratuwa, 2011. Amal S. Kumarage: Sustainable Transport Policies in Sri Lanka.
Workshop on Air Quality and Environmental Sustainable Transport, Colombo, Sri Lanka.
World Bank, 2015a. World Bank Development Indicators: Rural Environment and Land Use. Available
from http://wdi.worldbank.org/table/3.1
World Bank, 2015b. Country Overview: Sri Lanka.
Available from http://www.worldbank.org/en/country/srilanka/overview#1
World Bank, 2015c. Sri Lanka Transport Sector.
PORT/0,,contentMDK:20699037 menuPK:869140 pagePK:34004173 piPK:34003707 theSitePK:57959
Annexures
Annexure A: Financial Assessment
Parameter
Conventional Articulated Bus
Life of articulated bus
Study of BRT on Galle Road by University of Moratuwa
Electric Bus
Investment Cost per bus
Estimate for BYD Electric Bus
Additional cost of battery
Battery technology charges ahead, McKinsey
Life of electric bus
Estimate for BYD Electric Bus
Life of electric bus battery
Estimate for BYD Electric Bus
Performance of Bus
Technical specifications of BYD Electric Bus
Cost of electricity
Estimates from Ceylon Electricity Board
Other operating costs
Maintenance expenses
Road user charges
Yards & Terminals
IT service charge
Study of BRT on Galle Road by University of Moratuwa
Total Operational Cost (Excluding fuel cost)
Other Assumptions
Average distance travelled per bus per annum
Study of BRT on Galle Road by University of Moratuwa
Study of BRT on Galle Road by University of Moratuwa
1 Sri Lankan Rupee
A.1: NAMA Baseline Scenario: Utilization of diesel fuelled internal combustion engine (ICE) buses
The following table details the financial costs, capital and operating, of utilizing conventionally fuelled buses in the Galle BRT:
Conventional Bus Scenario
Parameter
8,594,482 8,594,482
8,594,482 8,594,482
Total outflow
19,500,000
8,594,482 8,594,482
8,594,482
8,594,482
28,094,482
8,594,482
8,594,482
8,594,482 8,594,482
8,594,482
A.2: NAMA Mitigation Scenario: Adoption and utilization of electric buses
The following table details the financial costs, capital and operating, of replacing conventionally fuelled buses with electric buses in the Galle BRT:
Electric Bus Scenario
Parameter
Capital cost –
5,578,553 5,578,553
5,578,553 5,578,553
Total outflow
4,20,00,000
55,78,553 55,78,553
55,78,553
55,78,553 1,20,58,553
55,78,553
55,78,553
55,78,553 55,78,553
55,78,553
A.3: Difference in Cash Flows of NAMA baseline and mitigation scenarios
The following table details the differences between the cash flows of the NAMA baseline and mitigation scenarios:
Difference
in cash flow
Net Present
Value (NPV)
Total GHG
emission
reductions
Marginal
abatement
Appendix B: Emissions Calculations
B.1: NAMA emissions baseline (Diesel fuel for internal combustion engine
(ICE) buses)
Emission factor for Diesel ICE bus (EFBL,km,i) (gCO2/km):
BL,km,i = SFCi x NCVBL,i x EFBL, i
Parameter
Fossil fuel used in ICE bus
Specific fuel consumption of baseline vehicle (SFCi)
Net calorific value of fossil fuel consumed by baseline vehicle (NCVBL,i)
44195.861
Emission factor of fossil fuel consumed by baseline vehicle (EFBL, i)
0.00007262
Emission factor for diesel ICE bus:
Parameter
Value (gCO2/km)
Emission factor for ICE bus
Total emissions for diesel ICE bus (BEy) (tCO2):
BEy = EFBL,km,i x DDi,y x Ni,y x 10-6
Parameters
Emission factor for diesel ICE bus (EFBL)
Annual average distance travelled (DD)
100Error! Bookmark not
Number of operational diesel ICE buses (N)
Emissions for diesel ICE bus:
Parameter
Value (tCO2)
Emissions for a diesel ICE bus
1 Calorific values of fuels were obtained from the specifications published by the Ceylon Petroleum Corporation – Petroleum Data Product Specifications
2 2006 IPCC Guidelines for National Greenhouse Gas Inventories –
B.2: NAMA project emissions (e-Buses)
Emission factor for electric bus (EFPJ,km,i,y) (kgCO2/km):
EFPJ,km,i,y = SECPJ,km,i,y x EFelec,y/(1 - TDLy)
Parameters
Specific electricity consumption by the electric bus (SECPJ,km,i,y)
1.1930353
CO2 emission factor of electricity consumed by electric bus (EFelec,y)
kgCO2/KWh
Average technical transmission and distribution losses for providing
electricity (TDLy)
Emission factor for electric buses:
Parameters
Value (kgCO2/km)
Emission factor for electric bus
0.9964554
Total emissions for electric bus (PEy) (tCO2):
y = EFPJ,km,I,y x DDi,y x Ni,y
Parameters
Emission factor for electric bus (EFPJ,km,I,y)
kgCO2/km
0.9964554
Annual average distance travelled by electric bus (DDi,y)
Number of operational electric buses (Ni,y)
Emissions for electric bus:
Parameters
Value (tCO2)
Emission for an electric bus
3 BYD Electric Bus Specifications - http://www.byd.com/na/auto/ElectricBus.html
4 World Bank Electric power transmission and distribution losses (% of output) - http://data.worldbank.org/indicator/EG.ELC.LOSS.ZS
Appendix C: Sustainable Indicators
C.1: Environment Indicators
Relevance to SDG including
Effect on
Indicator
Identified Impacts
Explanation of chosen indicator
indicator
Build inclusive, safe and sustainable cities and human settlements
11.6 by 2030, reduce the adverse
The adoption of electric buses in the BRT would lead
per capita environmental impact of
to a decrease in the pollution caused from the
Air Pollution
cities, including by paying special
Better air quality
burning of fossil fuels due to the use of conventional
attention to air quality, municipal
buses. This leads to an increase in the air quality in
and other waste management
Environment
Build inclusive, safe and sustainable cities and human settlements
The development of a BRT will lead to a streamlining
11.6 by 2030, reduce the adverse
of traffic in the city, subsequently reducing the traffic
Other (Noise /
per capita environmental impact of
congestion, making life much easier for commuters.
Visibility)
cities, including by paying special
pollution, congestion
Also, the use of electric buses will lead to a decrease
attention to air quality, municipal
in the noise pollution caused by the vehicles owing to
and other waste management
the fact that electric vehicles by nature are very quiet.
C.2: Social Indicators
Relevance to SDG including
Effect on
Indicator
Identified Impacts
Explanation of chosen indicator
indicator
Attain healthy life for all at all ages
3.6 by 2020 halve global deaths
and injuries from road traffic
accidents
The adoption of electric buses in the BRT would lead to a decrease in the pollution caused from the burning of fossil fuels due to the use of conventional
buses. This should lead to a decrease in the no. of air
pollution related health issues such as asthma and other respiratory diseases. The development of the
3.9 by 2030 substantially reduce
BRT should also lead to a streamlining of traffic in the
the number of deaths and illnesses
city leading to a decrease in the no. of traffic
from hazardous chemicals and air,
accidents that occur.
water, and soil pollution and contamination
Build inclusive, safe and sustainable cities and human settlements
11.2 by 2030, provide access to
Provides
safe, affordable, accessible and
vulnerable
The development of a BRT with cheap fares,
sustainable transport systems for
Increased access to
especially when compared to private means of
all, improving road safety, notably
public resources for
access to
transportation increases the level of access offered to
by expanding public transport, with
vulnerable sections of society, thereby allowing
special attention to the needs of
resources
greater development and mobility among these
those in vulnerable situations,
and services
women, children, persons with disabilities and older persons
Relevance to SDG including
Effect on
Indicator
Identified Impacts
Explanation of chosen indicator
indicator
Promote strong, inclusive and sustainable economic growth and decent work for all
8.3 promote development-oriented
policies that support productive
The development of a BRT with electric buses will
activities, decent job creation,
Job opportunities in
lead to the development of ancillary industries around
Quality of
entrepreneurship, creativity and
the skilled labour
the development and maintenance of electric
employment
innovation, and encourage
segment - Increased
vehicles, which in turn will lead to an increase in the
formalization and growth of micro-,
standard of living
no. of skilled jobs available in the market (this will be
small- and medium-sized
additional to the jobs that the BRT itself creates).
enterprises including through access to financial services
C.3: Growth & Development Indicators
Relevance to SDG including
Effect on
Indicator
Identified Impacts
Explanation of chosen indicator
indicator
Ensure access to affordable, sustainable and reliable modern energy services for all
7.a by 2030 enhance international
cooperation to facilitate access to
clean energy research and
technologies, including renewable
energy, energy efficiency, and
Increased access to
Development of a BRT with electric buses will call for
advanced and cleaner fossil fuel
clean and sustainable
the transfer of advanced clean technologies from
technologies, and promote
more developed economies such as China, Europe,
investment in energy infrastructure
Subsequent decrease
etc. and this opens up opportunities for collaboration,
and clean energy technologies
in costs, leading to
knowledge transfer and subsequent development of
7.b by 2030 expand infrastructure
greater adoption
indigenous clean technologies.
and upgrade technology for supplying modern and sustainable energy services for all in developing countries, particularly
Access to
clean and
Promote sustainable industrialization
Development
sustainable
9.a facilitate sustainable and
technology
resilient infrastructure development in developing countries through enhanced financial, technological and technical support to African countries, LDCs, LLDCs and SIDS
Increased access to
The development of a successful BRT will need the
9.b support domestic technology
clean and sustainable
adoption of ICT in a significant manner. This along
development, research and
with the adoption of electric buses as the NAMA
innovation in developing countries
Subsequent decrease
intervention should provide impetus for the
including by ensuring a conducive
in costs, leading to
development of sustainable industries around these
policy environment for inter alia
greater adoption
industrial diversification and value
addition to commodities
9.c significantly increase access to
ICT and strive to provide universal
and affordable access to internet in
LDCs by 2020
Relevance to SDG including
Effect on
Indicator
Identified Impacts
Explanation of chosen indicator
indicator
Promote sustainable consumption and production patterns
12.a support developing countries
to strengthen their scientific and
technological capacities to move
towards more sustainable patterns
of consumption and production
The use of electric vehicles and the increased cost
12.c rationalize inefficient fossil fuel
and fuel savings from the BRT will lead to a reduced
subsidies that encourage wasteful
dependence on imported fossil fuels which in turn
consumption by removing market
provides greater cost savings. These savings can
distortions, in accordance with
Reduced dependence
then be funneled into the sections of economy such
national circumstances, including
on imported fossil fuels
as education and health.
Security
by restructuring taxation and
- Greater energy
phasing out those harmful
security as well as cost
The BRT if accompanied with removal of inefficient
subsidies, where they exist, to
savings for the nation
fuel subsidies and other policies that encourage the
reflect their environmental impacts,
development of clean modes of energy, would lead to
taking fully into account the specific
the development of a more clean and sustainable
needs and conditions of developing
countries and minimizing the
Development
possible adverse impacts on their development in a manner that protects the poor and the affected communities
Promote actions at all levels to address climate change/build climate change goal based on COP 21 of the UNFCCC
13.3 improve education, awareness
The NAMA gives Sri Lanka an opportunity to
raising and human and institutional
extensively build capacity of its regional and national
capacity on climate change
institutions in the areas of development and
mitigation, adaptation, impact
capacity on both the
implementation of climate change mitigation projects.
reduction, and early warning
Capacity
national and regional
This will especially prove beneficial for subsequent
13.b Promote mechanisms for
Building
levels on development
climate change mitigation projects that Sri Lanka
raising capacities for effective
and implementation of
decide to take up, wherein with a strong institutional
climate change related planning
clean and sustainable
structure already present, the benefits that they can
and management, in LDCs,
reap from subsequent projects will be higher,
including focusing on women,
especially when it comes to directly increased funding
youth, local and marginalized
to the implementation of the project.
Relevance to SDG including
Effect on
Indicator
Identified Impacts
Explanation of chosen indicator
indicator
Strengthen and enhance the means of implementation and global partnerships for sustainable development
17.9 enhance international support
for implementing effective and
targeted capacity building in
developing countries to support
national plans to implement all
sustainable development goals,
including through North-South,
South-South, and triangular
cooperation
capacity on both the
The NAMA provides Sri Lanka numerous
Capacity
national and regional
opportunities to extensively collaborate with
17.18 by 2020, enhance capacity
Development
Building
levels on development
international agencies. Sri Lanka can use these
building support to developing
and implementation of
opportunities to build capacity in line with the best
countries, including for LDCs and
clean and sustainable
practices utilized around the world.
SIDS, to increase significantly the
availability of high-quality, timely and reliable data disaggregated by income, gender, age, race, ethnicity, migratory status, disability, geographic location and other characteristics relevant in national contexts
C.4: Economic Indicators
Relevance to SDG including
Effect on
Indicator
Identified Impacts
Explanation of chosen indicator
indicator
Promote strong, inclusive and sustainable economic growth and decent work for all
Lower dependence on
imported fossil fuels,
increased adoption of
8.2 achieve higher levels of
new, latest sustainable
The introduction of electric buses in the BRT should
productivity of economies through
technologies leading to
lead to the development of ancillary industries around
diversification, technological
greater cost savings
electric vehicles, which in turn will lead to the creation
upgrading and innovation, including
and returns over
of a new market of growth along with new
through a focus on high value
longer periods of time
opportunities for labour, especially skilled labour.
added and labor-intensive sectors
increased economic
Promote sustainable industrialization
Lower dependence on
generation /
imported fossil fuels,
Expenditure
9.1 develop quality, reliable,
Economic
increased adoption of
reduction /
sustainable and resilient
new, latest sustainable
Balance of
infrastructure, including regional
technologies leading to
The BRT will be one of the first key steps towards
payments
and trans-border infrastructure, to
greater cost savings
developing sustainable, clean transportation
support economic development
and returns over
infrastructure in Sri Lanka.
and human well-being, with a focus
longer periods of time
on affordable and equitable access
increased economic
Strengthen and enhance the means of implementation and global partnerships for sustainable development
17.1 strengthen domestic resource
Lower dependence on
The NAMA will give Sri Lanka tremendous
mobilization, including through
imported fossil fuels,
opportunities to extensively collaborate with and
international support to developing
increased adoption of
acquire funding from international agencies. Sri
countries to improve domestic
new, latest sustainable
Lanka can use these opportunities to understand and
capacity for tax and other revenue
technologies leading to
utilize best practices around the world to develop and
greater cost savings
implement a strong climate change mitigation
Relevance to SDG including
Effect on
Indicator
Identified Impacts
Explanation of chosen indicator
indicator
17.4 assist developing countries in
and returns over
program in the form of the transportation NAMA.
attaining long-term debt
longer periods of time
sustainability through coordinated
policies aimed at fostering debt
increased economic
financing, debt relief and debt
restructuring, as appropriate, and address the external debt of highly indebted poor countries (HIPC) to reduce debt distress
17.5 adopt and implement
investment promotion regimes for
LDCs
Promote sustainable industrialization
9.5 enhance scientific research,
upgrade the technological
The development of a BRT with electric buses will
capabilities of industrial sectors in
lead to the development of ancillary industries around
all countries, particularly
private/public sector
the development and maintenance of electric
developing countries, including by
investments, increased
vehicles, which will also lead to increase in
2030 encouraging innovation and
cost savings/returns
indigenous research and development and help
increasing the number of R&D
leading to increased
create conditions which when leveraged efficiently
workers per one million people by
accumulation of assets
will invite increased public/private investments.
x% and public and private R&D
Strengthen and enhance the means of implementation and global partnerships for sustainable development
investments
17.3 mobilize additional financial
resources for developing countries
from multiple sources
The NAMA will give Sri Lanka tremendous
17.5 adopt and implement
opportunities to extensively collaborate with
private/public sector
investment promotion regimes for
international leaders in sustainable development,
investments, increased
allowing Sri Lanka to develop a network of global
cost savings/returns
partnerships that she can leverage for further climate
17.17 encourage and promote
leading to increased
change mitigation projects, for both technical and
effective public, public-private, and
accumulation of assets
financial assistance.
civil society partnerships, building on the experience and resourcing strategies of partnerships
Relevance to SDG including
Effect on
Indicator
Identified Impacts
Explanation of chosen indicator
indicator
Promote strong, inclusive and sustainable economic growth and decent work for all
8.3 promote development-oriented
policies that support productive
activities, decent job creation,
The introduction of electric buses in the BRT should
Economic
Job creation
entrepreneurship, creativity and
lead to the development of ancillary industries around
Creation of skilled job
innovation, and encourage
electric vehicles, which in turn will lead to the creation
formalization and growth of micro-,
of a new market of growth along with new
small- and medium-sized
opportunities for labour, especially skilled labour.
enterprises including through access to financial services
C.5: Institutional Indicators
Relevance to SDG including
Effect on
Indicator
Identified Impacts
Explanation of chosen indicator
indicator
Revitalize the global partnership for sustainable development
17.17 encourage and promote
Private Sector
effective public, public-private, and
The NAMA has been designed to promote and
Dialogue
Increased involvement
civil society partnerships, building
of the private sector
encourage increased participation of private players
on the experience and resourcing
in the Sri Lankan transport sector, through the
strategies of partnerships
provision of financial support in the form of grants, subsidies and soft loans.
This also leads to increased partnerships between
the public and private sectors in the sustainable
Strengthened policy
transport sector leading to increased sources of
finance (private sector) thus providing alternatives to
involves extensive
address the issue of paucity of financing for
Enabling
sustainable transport initiatives.
17.14 enhance policy coherence
partnerships thus
for sustainable development
providing alternative
This model can then also be replicated across the
Environment
sources of finance to
develop a sustainable
transport sector in Sri
Contact us
Alexandra Soezer, Ph.D.
Manpreet Singh
Project Manager MDG Carbon
Associate Director, Climate Change
United Nations Development Programme
KPMG in India
Bureau for Policy and Programme Support
Building No. 10, 8th Floor, Tower B
304 E 45th Street, FF-910
DLF Cyber City, Phase - II
New York, NY 10017, USA
Gurgaon - 122002, India
2015 KPMG, an Indian Registered Partnership and a member firm of the KPMG network of independent
member firms affiliated with KPMG International Cooperative ("KPMG International"), a Swiss entity. Al rights
reserved.
The information contained herein is of a general nature and is not intended to address the circumstances of
any particular individual or entity. Although we endeavour to provide accurate and timely information, there
can be no guarantee that such information is accurate as of the date it is received or that it will continue to be
accurate in the future. No one should act on such information without appropriate professional advice after a
thorough examination of the particular situation.
Source: http://www.climatechange.lk/NAMAs/SL%20Transport%20Sector%20NAMA-Semi%20Final.pdf
Layout
Intelligent investing in Europefrom Bridgepoint Issue 16 November 2009 Perception and reality The truth behind consumer confidence POWER GAMES SAVOIR FAIRE MAY CONTAIN NUTS When children hold the purse strings speaks up for A question of confidenceThe state of mind of the consumer (or more accurately the complexrelationship between national prosperity and consumer confidence)is a key metric for many businesses and governments and is on theagenda for this issue of The Point. It was the economist JohnMaynard Keynes who showed us that too much prudence on thepart of the consumer could spell economic disaster, which is why somany governments around the world are introducing measuresdesigned to stimulate consumer expenditure.
Microsoft word - 4177447e-5e10-183ba3.doc
Guidelines for the Management of Asthma in California Schools A comprehensive resource for school health and other personnel to address asthma in the school setting Arnold Schwarzenegger Governor State of California Kimberly Belshé Secretary Director California Health and Human