Marine ecology progress series 530:119
Vol. 530: 119–134, 2015MARINE ECOLOGY PROGRESS SERIES
Published June 18
doi: 10.3354/meps11266 Mar Ecol Prog Ser
Habitat and trophic ecology of Southern Ocean
cephalopods from stable isotope analyses
Miguel Guerreiro1,*, Richard A. Phillips2, Yves Cherel3, Filipe R. Ceia1,
Pedro Alvito1, Rui Rosa4, José C. Xavier1,2
1MARE−Marine and Environmental Sciences Centre, Faculdade de Ciências e Tecnologia, Universidade de Coimbra,
3004-517 Coimbra, Portugal
2British Antarctic Survey, Natural Environment Research Council, High Cross, Madingley Road, Cambridge CB3 0ET,
3Centre d'Etudes Biologiques de Chizé, UMR 7372 du CNRS-Université de La Rochelle, BP 14, 79360 Villiers-en-Bois, France
4Laboratório Marítimo da Guia, Centro de Oceanografia, Faculdade de Ciências da Universidade de Lisboa,
Av. Nossa Senhora do Cabo, 939, 2750-374 Cascais, Portugal
ABSTRACT: Although cephalopods play a critical role in marine food webs both as predators andprey, there is a limited knowledge of several basic aspects of their ecology, including their habitatand trophic level, in the Southern Ocean. We examined the ecological role of several SouthernOcean cephalopod species by analyzing δ13C and δ15N values in lower cephalopod beaks obtainedfrom diet samples of wandering albatross Diomedea exulans from South Georgia (AtlanticOcean), and from Crozet and Kerguelen Islands (Indian Ocean). Beak δ13C values ranged from−25.7 to −17.9 ‰, and were used to assign different cephalopod species to the subtropical, sub-Antarctic or Antarctic Zones. Beak δ15N values were more variable among species, ranging from2.4 to 13.3 ‰, a difference of 11 ‰ that represents approx. 3 trophic levels. Differences amongislands in isotope ratios in the same cephalopod species (higher δ15N and lower δ13C values inSouth Georgia) were attributed to regional oceanographic processes. Antarctic cephalopodsoccupy niches similar to those found in some pelagic fish, seabirds and marine mammals. Ascephalopods are key components in Southern Ocean food webs, these results greatly advance ourunderstanding of the structure, energy and carbon flows in this polar ecosystem.
KEY WORDS: Southern Ocean · Pelagic ecosystem · Distribution · Foraging ecology · Kondakovia longimana · Diet Resale or republication not permitted without written consent of the publisher cephalopod species that thrive in the SouthernOcean are oegopsid squid and octo pods, including Cephalopods play an important role in the marine species that are entirely Antarctic, and other more food web of the Southern Ocean (here defined as south cosmopolitan species that either by active migration, of the Subtropical Front; see Fig. 1). They are thought or due to their deep-sea distribution, can cross the to occupy the ecological niche of pelagic fish (Rod- Antarctic Polar Front (APF) (Collins & Rodhouse house & White 1995), and sustain large populations 2006). Southern Ocean cephalopods are those who of top predators in the region (e.g. toothed whales, live south of the Subtropical Front (STF) at around seals, penguins, albatrosses and petrels), amounting 40° S (Fig. 1). Other longitudinal features in the to an estimated total consumption of around 34 mil- Southern Ocean include the Antarctic Circum polar lion t of cephalopods per annum (Clarke 1983). The Current (ACC), with a clockwise circulation around *Corresponding author: [email protected] Inter-Research 2015 · www.int-res.com Mar Ecol Prog Ser 530: 119–134, 2015 the Antarctic continent in the Atlantic, Indian and and about 2800 km from their colonies) (Imber 1992, Pacific sectors of the Southern Ocean, which deflects Weimerskirch et al. 1993, Xavier et al. 2004). Their northwards at 50−52° S (thereafter resuming its east- patchily-distributed prey are thought to include pri- erly course) in the Atlantic sector, contributing to an marily dead and moribund cephalopods that have increase in local productivity (Deacon 1982, Trathan floated to the surface post-spawning (Croxall & et al. 1997). The other major oceanographic feature Prince 1994, Cherel & Weimerskirch 1999, Xavier et in the Indian sector which contributes to a local increase in primary productivity is the Ker Stable isotope analysis (SIA) of cephalopod beaks Plateau, and also to some extent, the Crozet Islands.
gathered from the diet of top predators can provide Despite their importance, knowledge of several key ecological information (Cherel & Hobson 2005, basic aspects of the ecology of cephalopods is lim- Cherel et al. 2009b). SIA has been used increasingly ited, particularly in terms of distribution and trophic in the last 2 decades to study the structure of food ecology (Xavier et al. 1999, Collins & Rodhouse webs (e.g. Kelly 2000). With this approach, it is pos - 2006). One of the main reasons is the limited com- sible to infer habitat and trophic level of organisms mercial harvest, which reflects (1) the low number of based, respectively, on the stable isotope ratios of exploitable squid species, (2) the unpredictability of 13C to 12C (δ13C), and 15N to 14N (δ15N) (DeNiro & their stocks, (3) a lack of knowledge of the abun- Epstein 1978, 1981). In the pelagic waters of the dance and distribution of relevant species, and (4) an Southern Ocean, the carbon isotope ratio ultimately inability to catch the faster-moving species. Ship- reflects the influence of temperature on photosyn- based scientific surveys in the Southern Ocean en - thetic activity (Sackett et al. 1974), and CO2 avail - counter similar problems, not helped by the low trawl ability, leading to a broad δ13C latitudinal gradient speeds and use of conventional sampling methods in baseline values from equatorial to polar waters, (Clarke 1977, Rodhouse 1990, Rodhouse et al. 1996).
which is propagated through the food chain (Cherel The available information on diet and trophic rela- & Hobson 2007, Jaeger et al. 2010, Quillfeldt et al.
tionships is therefore limited largely to 2 common 2010). In contrast, the ratio of the stable isotopes of species, Martialia hyadesi and Moroteuthis ingens nitrogen can be used to estimate the trophic level of (Jackson et al. 2007), and otherwise biased towards an organism, as there is a stepwise enrichment of 15N cephalopods that feed on Antarctic krill Euphausia between prey and predators (Montoya 2007).
superba, as these are caught in the same nets (Nemoto The objectives of this study were to: et al. 1985, 1988).
(1) Characterize the habitat and trophic level of the An alternative approach to study Southern Ocean cephalopod fauna of the Atlantic and Indian sectors cephalopods, and to overcome these sampling prob- of the Southern Ocean by analysing the δ13C and lems, is to use seabirds that are cephalopod preda- δ15N values of cephalopod beaks (obtained from the tors, such as albatrosses (Cherel & Weimerskirch boluses [pellets] and induced regurgitations of wan- 1995, Xavier et al. 2003a). In general, albatrosses are dering albatrosses) as proxies for water mass (latitu- an excellent sampling tool for this kind of study be - dinal distribution) and trophic level, respectively; cause (1) they feed on a great number and diversity (2) Compare the trophic niche of these cephalo of cephalopods (Cherel & Klages 1998), (2) they pods based on stable isotope ratios with the few cur- breed in high densities on land and so are readily rent conventional diet studies; available for diet sampling, (3) they do not fear (3) Assess if each cephalopod species occupies the humans and are therefore easy to work with, (4) they same niche throughout the Southern Ocean; forage over and therefore sample large areas of the (4) Determine if any cephalopods occupy a similar ocean, and (5) chicks and adults retain undigested niche to top fish predators.
cephalopod beaks in their stomachs for long periodsof time. In the present study, we investigated thecephalopod fauna of the south Atlantic and Indian MATERIALS AND METHODS
sectors of the Southern Ocean using diet samples col-lected from wan dering albatrosses (Diomedea exu- lans) breeding at South Georgia, Crozet and Kergue-len islands. The wandering albatross feeds on a large Cephalopod beaks were collected from boluses variety of ce phalopod species on long foraging trips (from chicks) or induced regurgitations (from adults) that during the chick rearing period range from of wandering albatrosses during the breeding season Antarctic to subtropical waters (between 25−64° S at South Georgia (54° S, 38° W; south of the APF), Ker- Guerreiro et al.: Isotope values of Southern Ocean cephalopods guelen (49° S, 69° E, in the vicinity of the APF) and Stable isotope analysis
Crozet islands (46° S, 51° E, north of the APF) (Park etal. 1993) (Fig. 1). All samples were collected from We analyzed the stable isotope ratios of the September to December 1998, during the latter part cephalopod species that were represented by at least of the 8−9 mo chick-rearing period.
10 lower beaks from one of the island groups. For At South Georgia, the samples consisted of bo each species at each island, 10 beaks in good condi- luses, which are voluntarily regurgitated by chicks tion were randomly selected, with the exception of prior to fledging (Xavier et al. 2003a). These com- Taningia danae (a rare species) with only 5 speci- prise the indigestible parts of prey consumed during mens from Kerguelen, and Haliphron atlanticus (the the winter, from hatching in March or April to fledg- only octopod species) with 11 specimens from South ing in November or December (Xavier et al. 2003b, Georgia. In addition, to assess local ontogenic dif 2005, Xavier & Croxall 2007). Diet samples from ferences in Histioteuthis atlantica, 2 size-classes of Crozet and Kerguelen were obtained by induced beaks were compared (large and small), which dif- regurgitation immediately after the chick was fed fered in LRL at the same island (for Kerguelen and by one of its parents (Cherel & Weimerskirch 1999).
South Georgia) by a mean of 2 mm. Prior to the Samples were frozen at −20°C and subsequently analysis, the whole beaks were dried at 60°C and analyzed in the laboratory. The beaks obtained from ground into a fine powder; due to an oversight, infor- each sample were cleaned, separated into upper mation on individual beak identity was not retained and lower beaks, and counted. When possible, the and so it was not possible to relate LRL to subsequent lower beaks were identified to species level (Xavier measurements. Sub-samples (ranging from 0.30− & Cherel 2009) and the lower rostral length (LRL) 0.55 mg) of each beak were placed in a tin capsule was measured. Beak identification was confirmed and the stable isotope values were measured using a with reference to collections at the British Antarctic Flash EA 1112 Series elemental analyzer coupled Survey and Centre d'Etudes Biologiques de Chizé.
online via a Finnigan ConFlo II interface to a Delta V Cleaned beaks were kept in 70% ethanol until iso- S mass spectrometer (Thermo Scientific). Analysis of topic analysis.
the whole beak provides an integrated, lifetime sig-nal of diet and geographic position, although biasedtowards more recent periods, when mass incrementsare greater, rather than to younger ages. The carbonand nitrogen isotope ratios were expressed in delta(δ) notation relative to Vienna PDB limestone for δ13Cand atmospheric nitrogen (AIR) for δ15N, respec-tively. Replicate measurements of internal laboratorystandards (acetanilide) indicated measurement errorsof < 0.15 ‰ for both δ13C (−28.38 to −27.73 ‰) andδ15N (1.76−2.41‰) values.
Samples with δ13C values greater than −19.5 ‰ were considered to have a subtropical distribution(north of the Subtropical Front), and those with val-ues less than −22.9 ‰ were considered to be fromAntarctic waters (south of the APF) (Cherel & Hobson2007, Jaeger et al. 2010); those with intermediate values (between −22.9 and −19.5 ‰) were consideredto be of sub-Antarctic origin. Habitat assignmentswere based on the estimated isotopic positions of Fig. 1. Map of the Southern Ocean indicating the sampling APF and STF based on stable isotope ratios in plasma sites at South Georgia, Crozet and Kerguelen, and the sampled from albatrosses (Jaeger et al. 2010), and 1000 m isobath (dark grey line). Antarctic Polar Front (PF), blood from penguins (Cherel & Hobson 2007). These Sub-Antarctic Front (SAF), and Subtropical Front (STF) are the main oceanic fronts (black line patterns) cut-offs may not be as appropriate for cephalopods, Mar Ecol Prog Ser 530: 119–134, 2015 even though these are depredated by albatrosses, due to differences in trophic levels and in tissue- andspecies-specific isotopic discrimination factors. There - Lower beaks (n = 384) of 16 species collected at the fore, we adopted a conservative approach, distin- 3 island groups (i.e. South Georgia, Crozet and Ker- guishing Antarctic and subtropical species of cephalo - guelen) from the Atlantic and Indian sectors of the pods based on the highest δ13C value of the 2 studies Southern Ocean were included in the study. These for the STF (−19.5 ‰ Eudyptes chrysocome moseleyi species comprised 95% of the total number of lower blood; Cherel & Hobson 2007) and the lowest δ13C for beaks found in the diet samples of wandering alba- the APF (−22.9 ‰ Diomedea exulans plasma; Jaeger trosses (cephalopod component) from all 3 sites et al. 2010).
(J. Xavier and Y. Cherel unpubl. data).
Albatrosses have long foraging distances, and so sample cephalopods over a wide latitudinal range.
As the δ13C of their squid prey will reflect the point of Beak δ13C values
origin of the squid, differences in foraging ranges ofthe individual birds per se should not affect our δ13C values in the beaks of individual cephalopods results or conclusions.
ranged from −25.7 (Kondakovia longimana, SouthGeorgia) to −17.9 ‰ (Histioteuthis atlantica, Kergue-len) (Table 1, Figs. 2–4). The species displaying high- Stable isotope niches and isotope metrics
est values was H. atlantica (Crozet; mean: –18.6 ‰),and the lowest were found in Batoteuthis skolops Corrected standard ellipse areas (SEAc) and (South Georgia; mean: –24.4 ‰). When compared Bayesian standard ellipse areas (SEAb) were calcu- among localities, significantly lower δ13C values were lated in order to examine inter- and intra-specific found in samples of B. skolops, Galiteuthis glacialis, niche size and overlap. Overlap among species pairs Histioteuthis eltaninae and K. longimana from South was categorized as high (area of overlap ≥ 50% of the Georgia (p < 0.05 in all cases) (Table 2). The highest smaller niche area) or low (area of overlap < 50% of δ13C values for H. atlantica (large size) and Martialia the smaller niche area). Standard ellipse areas were hyadesi were found in samples from Kerguelen.
plotted for visualization of the data, using the SIAR Beak δ13C values for Moroteuthis knipo vitchi were package for R (Parnell et al. 2010, Jackson et al.
significantly greater in samples from Crozet than Kerguelen (p < 0.05) (Table 2).
Beak δ15N values
All statistical analyses used a significance level of Beak δ15N values of individual cephalopods ranged α = 0.05, and were performed using R. ANOVAs and from 2.4 ‰ (M. hyadesi, Crozet) to 13.3 ‰ (Gonatus t-tests were conducted to test for differences in stable antarcticus, South Georgia) (Table 1, Figs. 2–4). The isotope ratios in squid beaks collected at the different species with highest values for δ15N was Cicloteuthis island groups. Data on Martialia hyadesi were trans- akimush kini (Crozet: mean: 12.2 ‰) and the lowest formed exponentially to fit the assumptions of normal values were for M. hyadesi (Crozet; mean: 3.6 ‰).
distribution and homoscedasticity. Results of statisti- When compared to other sites, significantly higher cal tests are presented as t-values, both for the t-tests values of δ15N were observed for G. antarcticus and and ANOVAs, as the post hoc test used was the pair- small H. atlantica, and lower values for B. skolops at wise Tukey HSD. Principal components analysis South Georgia (p < 0.05 in all cases) (Table 3). Higher (PCA) (extracted from the variables average LRL, δ15N values were obtained for Taonius sp. (Clarke) and δ13C and δ15N of each group [island populations] M. hyadesi from Kerguelen (p < 0.05 in all cases) covariance matrix), and cluster analysis (CA) (stan- (Table 3). The lowest mean δ15N value for samples of dardized variables, Ward's linkage) were used to Taonius sp. B (Voss) was obtained for beaks sampled at assess segregation of various species throughout the Crozet (p < 0.05) (Table 3). Moreover, δ15N values in H. Southern Ocean according to the average δ13C and eltaninae were higher at South Georgia than at Ker - δ15N of each group. As beaks from Haliphron atlanti- guelen. In contrast, δ15N values in K. longimana from cus were eroded, mean LRL (for PCA) was obtained Kerguelen were higher than those from South Georgia, from Xavier et al. 2003b.
whereas those in ?Mastigoteuthis sp. A (Clarke) and Guerreiro et al.: Isotope values of Southern Ocean cephalopods osses at South Geor guelen Islands. nd = not deter N values, and C:N ratios of the main squid species found in the diet of wandering albatr ozet Islands, and Ker on atlanticus oteuthis antar oteuthis antar tialia hyadesi oteuthis ingens oteuthis antar tialia hyadesi aningia danae Gonatus antar Gonatus antar Gonatus antar stral length (LRL) and beak o ozet Islands
South Geor
Mar Ecol Prog Ser 530: 119–134, 2015 –26 –24 –22 –20 –18 –26 –24 –22 –20 –18 Fig. 2. Plotted distribution of the δ15N and δ13C in beaks of Fig. 3. Plotted distribution of the δ15N and δ13C in beaks of the squid species from Crozet Islands. Blue and red vertical the squid species from Kerguelen. Blue and red vertical lines indicate estimated δ13C values corresponding to the lines indicate estimated δ13C values corresponding to the Antarctic Polar (PF) and Subtropical fronts (STF), respec- Antarctic Polar (PF) and Subtropical fronts (STF), respec- tively. Bayesian standard ellipse areas are displayed for the tively. Bayesian standard ellipse areas are displayed for the various cephalopod species: Allu = Alluroteuthis antarcticus, various cephalopod species: Allu = Alluroteuthis antarcticus, Bato = Batoteuthis skolops, Eltan = Histioteuthis eltaninae, Bato = Batoteuthis skolops, Cyclo = Cycloteuthis akimush - Galit = Galiteuthis glacialis, Gonat = Gonatus antarcticus, kini, Eltan = Histioteuthis eltaninae, Galit = Galiteuthis H.atlantL = Histioteuthis atlantica (large), Ingens = Moro- glacialis, Gonat = Gonatus antarcticus, H.atlantL = His - teuthis ingens, Knipo = Moroteuthis knipovitchi, Konda = tioteuthis atlantica (large), H.atlants = Histioteuthis atlan - Kondakovia longimana, Mart = Martialia hyadesi, Mast = tica (small), Knipo = Moroteuthis knipovitchi, Konda = ?Mastigoteuthis sp. A (Clarke), Taon = Taonius sp. (Clarke), Kondakovia longimana, Mart = Martialia hyadesi, Taning TaonB = Taonius sp. B (Voss) = Taningia danae, Taon = Taonius sp. (Clarke), TaonB = Taonius sp. B (Voss) M. knipovitchi from South Georgia were higher thanthose found at Crozet (p < 0.05 in all cases) (Table 3).
antarcticus, G. glacialis, H. eltaninae, ?Mastigoteuthissp. A (Clarke), Hali phron atlanticus). Species nichesize (SEAc) varied from < 0.5 (e.g. M. ingens = 0.2, H. Stable isotope niches and isotope metrics
atlanticus = 0.3) to > 4 (e.g. G. antarcticus of SouthGeorgia = 4.5, K. longimana of Kerguelen = 4.8).
The cephalopod fauna of the Southern Ocean was The degree of overlap in isotopic niche differed represented by 3 major groups (Figs. 2–5) of species among the 3 island groups depending on the spe- with overlapping niches and 1 outlier: (1) medium cies, especially comparing between South Georgia δ15N and δ13C values (K. longimana, M. knipovitchi, and the other sampling sites (Crozet and Kerguelen Moroteuthis ingens, Alluroteuthis ant Islands). Isotopic niches of specimens from Crozet glacialis, H. eltaninae, ?Mastigoteuthis sp. A (Clarke), showed either a low overlap with the same species Haliphron atlanticus), (2) high δ15N and average δ13C at the other 2 sites, a high overlap between Crozet values (B. skolops, G. antarcticus, Taonius sp. B (Voss) and Kerguelen (B. skolops, H. eltaninae, K. longi- and Taningia danae), and (3) high δ15N and δ13C val- mana, Histioteuthis atlantica large), or a high over- ues (Histioteuthis atlantica, Taonius sp. [Clarke] and lap between Kerguelen and South Georgia (M. C. akimushkini), and the outlier M. hyadesi (ex- knipo vitchi, Taonius sp. B [Voss]). Regardless of the tremely low δ15N) (Figs. 3–5). The first group can be overlap, the overall isotopic niche sizes, however, further divided into 2 sub-groups: (1) species with seemed to be similar across sites. The exceptions lower δ13C values that show low overlap (K. longi- were a few species at Crozet which had isotopic mana, M. knipo vitchi), and (2) species with higher niches that were smaller than at the other δ13C values and high levels of overlap (M. ingens, A. groups (K. longimana and H. eltaninae).
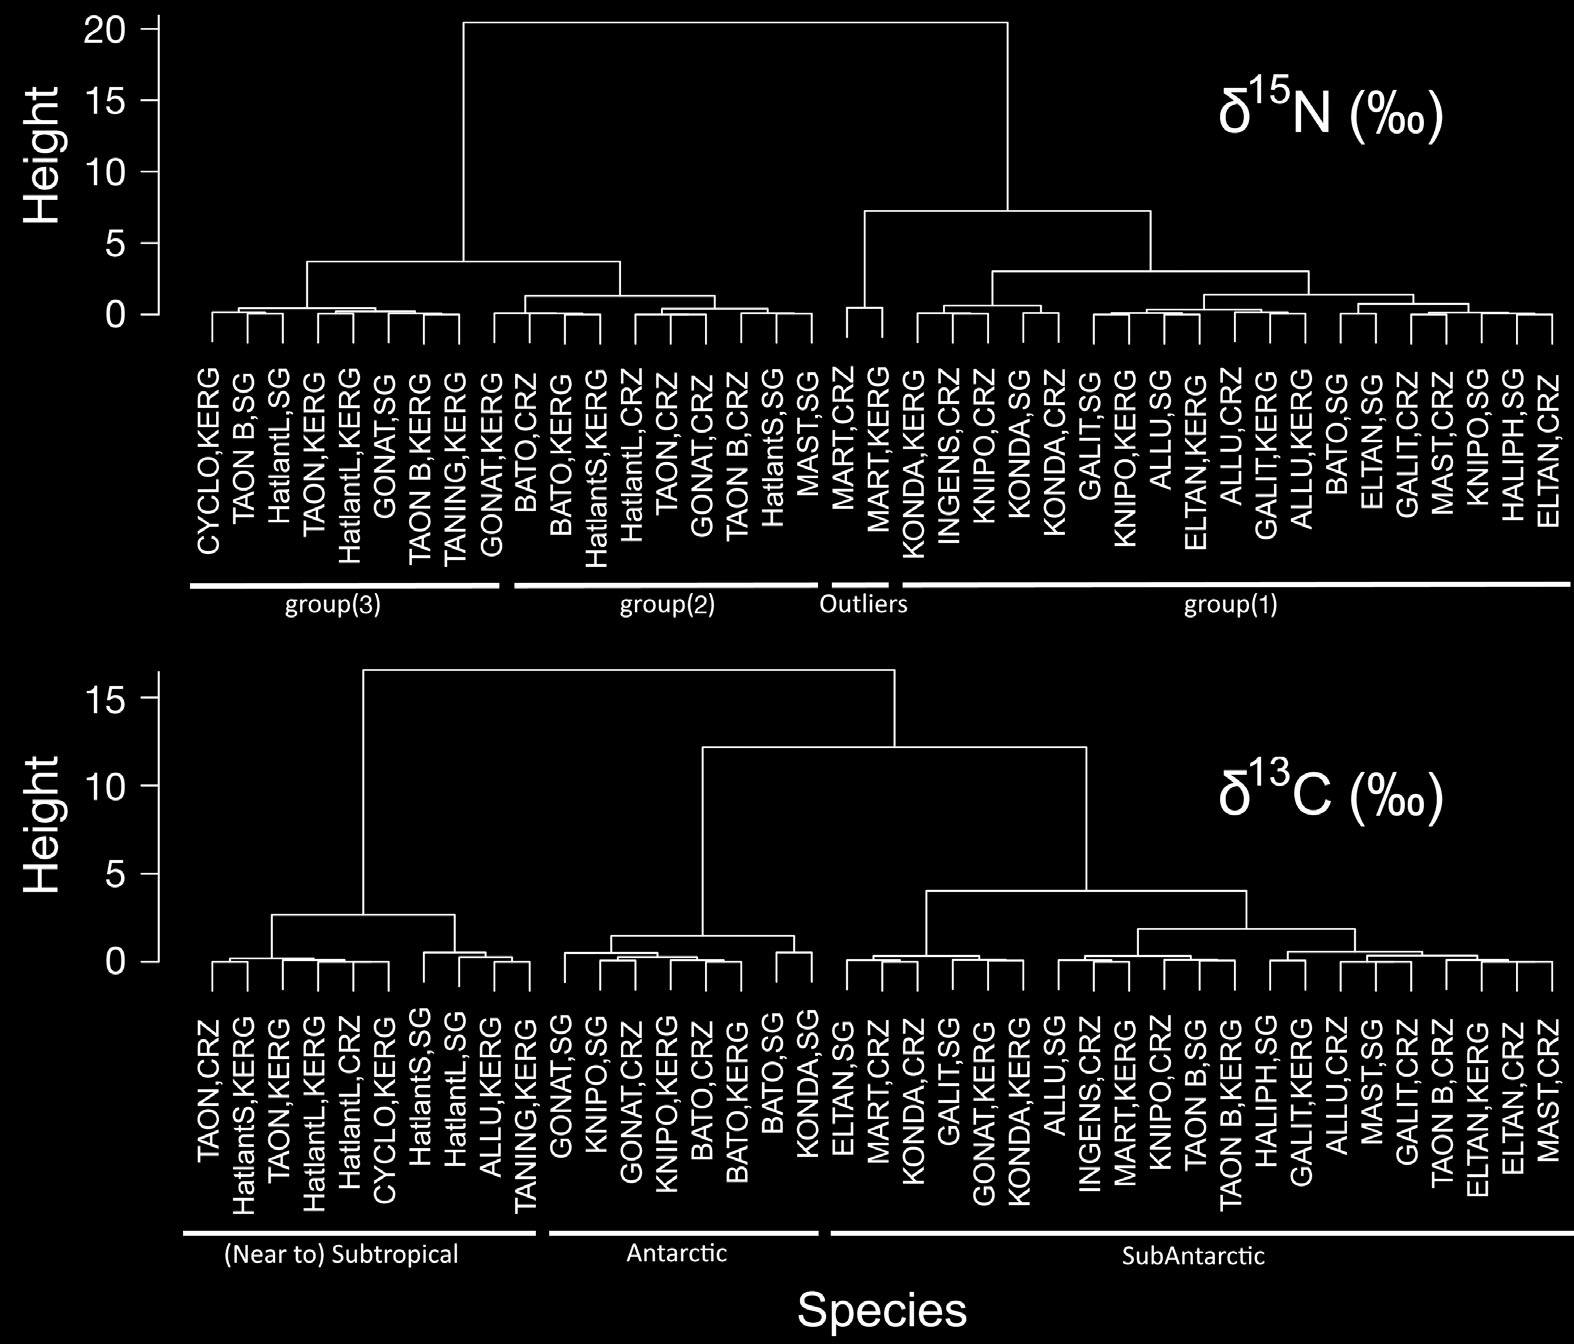
Guerreiro et al.: Isotope values of Southern Ocean cephalopods The first 2 principal components (PC) explained > 89% of the overall variance (Fig. 6). Mean LRL loaded heavily and positively on the first axis (PC1), and mean δ15N (and to a lesser extent mean δ13C) loaded heavily and positively on the second axis (PC2) (Fig. 6). Large species tended to be associated with a positive score on PC1, whereas subtropical species tended to be associated with a positive score on PC2 (Fig. 7). The 2 dendrograms produced by the CA (Fig. 8), showed 2 different aggregation patternsaccording to the SI ratio used: a clear separation near the top (root) between species with high and lowδ15N (2 groups), and 3 separate groups of species based on δ13C values.
–26 –24 –22 –20 –18 Fig. 4. Plotted distribution of the δ15N and δ13C in beaks ofthe squid species from South Georgia. Blue and red vertical The results indicate that δ13C tended to be lower, lines indicate estimated δ13C values corresponding to the δ15N tended to be higher, and that both ratios showed Antarctic Polar (PF) and Subtropical fronts (STF), respec-tively. Bayesian standard ellipse areas are displayed for the higher variance in the lower beaks of cephalopods various cephalopod species: Allu = Alluroteuthis antarcticus, from South Georgia compared to conspecifics in the Bato = Batoteuthis skolops, Eltan = Histioteuthis eltaninae, Indian sector of the Southern Ocean. Based on the sta- Galit = Galiteuthis glacialis, Gonat = Go natus antarcticus, ble isotope data, the cephalopods in the diet of the Haliph = Haliphron atlanticus, H.atlantL = Histioteuthisatlantica (large), H.atlants = Histioteuthis atlantica (small), wandering albatross were from 3 water masses (Ant - Knipo = Moroteuthis knipovitchi, Konda = Kondakovia arctic, sub-Antarctic and subtropical), and spanned longimana, Mast = ?Mastigoteuthis sp. A (Clarke), TaonB = over 3 trophic levels from Martialia hyadesi to Gona- Taonius sp. (Clarke) tus antarcticus (based on δ15N range divided by 3.3,where 3.3 equals the stepwise enrichment in δ15Nfrom prey to predator/consumer [Wada et al. 1987]).
Table 2. Tests (a posteriori) comparing δ13C values of the squid sampled at South Georgia (SG), Crozet (CRZ) and Kerguelen (KRG). Tests: A = ANOVA, Tukey tests (2 df); T = t-test (1 df); ns = non-significant; blank cell = non-existent pair Taonius sp. (Clarke) Taonius sp. B (Voss) Histioteuthis atlantica small Histioteuthis atlantica large ?Mastigoteuthis sp. A (Clarke) Martialia hyadesi Mar Ecol Prog Ser 530: 119–134, 2015 Table 3. Tests (a posteriori) comparing δ15N values of the squid sampled at South Georgia (SG), Crozet (CRZ) and Kerguelen(KRG). Tests: A = ANOVA, Tukey tests (2 df); T = t-test (1 df); T(EXP) = t-test on exponentially transformed variables (1 df); ns = non-significant; blank cell = non-existent pair Taonius sp. (Clarke) Taonius sp. B (Voss) Histioteuthis atlantica small Histioteuthis atlantica large ?Mastigoteuthis sp. A (Clarke) Martialia hyadesi The ce phalopod community appeared to consist of 3separate assemblages (average δ15N and δ13C, high δ15N and low δ13C, high δ15N and δ13C) and one outlier, M. hyadesi. Furthermore, the cephalopod community showed significant intra-specific differences in their isotopic niches associated with the island group.
Beak δ13C values and biogeography
The low δ13C found in squid beaks collected at South Georgia may be due to the higher latitude of the sampling location compared to Crozet and Ker- –26 –24 –22 –20 –18 Fig. 5. Plotted distribution of the δ15N and δ13C in beaks of thesquid species from the Southern Ocean. Blue and red vertical lines indicate estimated δ13C values corresponding to theAntarctic Polar (PF) and Subtropical fronts (STF), respec-tively. Bayesian standard ellipse areas are displayed for the various cephalopod species: Allu = Alluroteuthis ant arcticus,Bato = Batoteuthis skolops, Cyclo = Cycloteuthis aki mush -kini, Eltan = Histioteuthis eltaninae, Galit = Galiteuthis gla - 2nd Component (24% variance) –1.0 cialis, Gonat = Gonatus antarcticus, Haliph = Haliphron at-lanticus, H.atlantL = Histioteuthis atlantica (large), H.atlants −1.0 −0.5 0.0 0.5 1.0 = Histioteuthis atlantica (small), Ingens = Moroteuthis in- 1st Component (65% variance) gens, Knipo = Moroteuthis knipovitchi, Konda = Konda ko vialongimana, Mart = Martialia hyadesi, Mast = ?Mastigoteuthis Fig. 6. Loadings on the first 2 principal components (PC1 sp. A (Clarke), Taning = Taningia danae, Taon = Taonius sp. and PC2) for the mean values of variables lower rostral (Clarke), TaonB = Taonius sp.B (Voss) length (LRL), δ13C and δ15N
Guerreiro et al.: Isotope values of Southern Ocean cephalopods
Fig. 7. Individual principal component scores (from PC1 and
PC2 displayed in Fig. 6) of each sample area (SG = South
Georgia, CRZ = Crozet Islands, KRG = Kerguelen Islands)
and squid species:
= Alluroteuthis antarcticus, =
teuthis skolops, =
Histioteuthis eltaninae, =
glacialis, =
Gonatus antarcticus, =
Histioteuthis atlan tica
Histioteuthis atlantica (small), =
ingens, =
Moroteuthis knipovitchi, =
Konda kovia longi-
Martialia hyadesi, =
?Mastigoteuthis sp. A
Taonius sp. (Clarke),
= Taonius sp. B (Voss),
= Cycloteuthis akimushkini, =
Taningia danae, =
Fig. 8. Dendrograms produced by Cluster Analysis (using standardized variables and Ward's linkage method) showing aggre-gations of species and sample areas (SG = South Georgia, CRZ = Crozet Islands, KERG = Kerguelen) based on δ15N (upperpanel) and δ13C (lower panel) data, and their functional classification (below each dendrogram). ALLU = Alluroteuthis antarcti-cus, BATO = Batoteuthis skolops, CYCLO = Cycloteuthis akimushkini, ELTAN = Histioteuthis eltaninae, GALIT = Galiteuthisglacialis, GONAT = Gonatus antarcticus, HALIPH = Haliphron atlanticus, HatlantL = Histioteuthis atlantica (large), HatlantS =Histioteuthis atlantica (small), INGENS = Moroteuthis ingens, KNIPO = Moroteuthis knipovitchi, KONDA = Kondakovia longi-mana, MART = Martialia hyadesi, MAST = ?Mastigoteuthis sp. A (Clarke), TANING = Taningia danae, TAON = Taonius sp.
(Clarke), TAON B = Taonius sp. B (Voss)
Mar Ecol Prog Ser 530: 119–134, 2015
guelen (south vs. north of the APF, respectively).
Also, some squid from higher latitudes (e.g. Moro-
teuthis knipovitchi, Table 4) in Kerguelen showed
lower δ13C values than the same species from the
lower latitude site at Crozet. However, this was not
true in all species (e.g. M. hyadesi and Histioteuthis
atlantica, Table 4), possibly due to the higher base-line
δ13C of the Kerguelen Plateau (Trull et al. 2008).
To enable comparison with other studies, the mean
isotope ratio in soft tissue was estimated, by subtract-
ing 0.75 ‰ from the δ13C values measured in the
beaks (Hobson & Cherel 2006). These corrected val-
n Ocean and infer
ues and their assigned distribution (Cherel & Hobson
; ?: no known distribution for this species
2007, Jaeger et al. 2010) was then contrasted with
previous assessments (Xavier et al. 1999, Collins &
Known distribution
Rodhouse 2006, Xavier & Cherel 2009) (Table 4).
Cephalopod species that were previously considered
to live at high latitudes (according to Xavier et al.
1999, our Table 4) — Batoteuthis skolops, Kondakovia
osses in the Souther
longimana and M. knipovitchi — had the lowest mean
δ13C (and high standard deviations, except for B.
skolops). Surprisingly, G. antarcticus also displayed
very low values, despite previous evidence that it ismostly distributed in northern sub-Antarctic waters
ssessed water mass
(Xavier et al. 1999, Collins & Rodhouse 2006). The
high standard deviation in δ13C recorded in K. longi-
mana and M. knipovitchi, and low mean values in
opical waters (see Fig. 1); Cos.: cosmopolitan
G. antarcticus can be explained by a broader distri -bution of these species, including north and south of
the APF, in agreement with Cherel & Weimerskirch
(1999). Therefore, these 3 species (K. longimana, M.
knipovitchi and G. antarcticus) are distributed across
the APF (both in Antarctic and sub-Antarctic waters),
whereas B. skolops is found exclusively in Antarctic
waters (Fig. 5, Table 4). The so-called subtropical spe-
cies that were sampled (Taonius sp. [Clarke], Taonius
sp. B [Voss 1980], Cycloteuthis akimushkini and His-tioteuthis atlantica [Voss et al. 1998]) (Table 4), were
those with the highest δ13C, indicating distributions
that are around and to the north of the STF (Fig. 5,
ctic; Sub-Ant.: sub-Antar
δ13C values typical of sub-Antarctic waters were ob-
tained for numerous species (Haliphron atlanticus,
on atlanticus
Taningia danae, M. ingens, M. hyadesi, H. eltani-
oteuthis antar
nae, Taonius sp. B [Voss], Alluroteuthis antarcticus,
tialia hyadesi
oteuthis ingens
C in the mantle (muscle) of the main squid species in the diet of wandering albatr
aningia danae
Galiteuthis glacialis and ?Mastigoteuthis sp. A
Gonatus antar
[Clarke]) (Fig. 5, Table 4). Collins & Rodhouse (2006)and Xavier et al. (1999) considered that A. antarcticusand G. glacialis live primarily in Antarctic waters;
however, our isotopic data suggest that some indi
viduals inhabit sub-Antarctic waters (Table 4).
Furthermore, clustering of species based on
es-ence, 0 = absence. Ant.: Antar
able 4. Estimated
(Fig. 8), supports the biogeographic assessment dis-
Guerreiro et al.: Isotope values of Southern Ocean cephalopods
cussed above. The 3 clusters distinguished in that
skolops, G. antarcticus, Taonius sp. B (Voss) and
analysis correspond unequivocally to cephalopods
Taningia danae; and finally (3) the subtropical squid
originating from Antarctic, sub-Antarctic or (near to)
C. akimushkini, Histioteuthis atlantica and Taonius
subtropical waters.
sp. (Clarke). This classifi cation is confirmed by themultivariate analysis (Figs. 7 & 8), which distin-guished 2 large, well-defined groups (with M. hya -
Beak δ15N values and trophic relationships
desi and group (1) in the first, and groups (2) and (3)in the second) (Fig. 8).
Several cephalopod species showed higher δ15N
By correcting the measured δ15N values for beaks
in samples from South Georgia than from the other
to provide estimates for soft tissue (by adding 4.86 ‰;
island groups (especially Crozet), which suggests
Hobson & Cherel 2006), and comparing these re sults
that either squid at South Georgia have different
with muscle samples collected in previous studies in
feeding preferences (higher trophic level) from those
the same regions (Tables 5 & 6), it is possible to infer
in the Indian Sector, or there are regional differences
potential prey. However, this is with the caveat that
in primary productivity that lead to differences in
these correction factors may not be appropriate for all
δ15N baselines between regions, relating to the rela-
species. Nevertheless, the most probable niches occu-
tive dominance of eukaryote vs. prokaryote (auto-
pied by these animals are as follows. M. hyadesi is
trophic) production (Fawcett et al. 2011). Regardless,
known to feed mainly on hyperiid am
the present study largely confirms previous findings
myctophid fish, and to a lesser extent on cephalo
based on stable isotope analysis for most of the stud-
pods, including a degree of cannibalism (Rodhouse
ied species (Cherel & Hobson 2005, Cherel et al.
et al. 1992). Since myctophid fish tend to be at a sim-
2008), with the exception of K. longimana and G.
ilar or higher trophic level based on nitrogen isotope
antarcticus, for which δ15N values were higher than
ratios (Tables 5 & 6) (Cherel et al. 2008), it seems that
those recorded previously (Wada et al. 1987, Cherel
M. hyadesi feeds on myctophids in lower quantities
& Hobson 2005, Cherel et al. 2008).
than previously suggested, at least in the southern
The distribution of δ15N in the different species
Indian Ocean. K. longimana presented very low δ15N
suggested 3 distinct groups and one outlier (M.
values (and high LRL; Fig. 7), but not low enough
hyadesi). The 3 groups were: (1) the onychoteuthid
to be entirely dependent on euphausiids (Table 5)
squids (with the lowest δ15N values, especially K.
(Nemoto et al. 1985, 1988), and thus its diet seems
longimana) plus Haliphron atlanticus, H. eltaninae,
likely to include some prey with low δ15N values such
cialis; (2) ?Mastigoteuthis sp. A (Clarke), B.
as crustaceans and myctophid fish (Table 6) (Kaehler
Table 5. Estimated δ15N values in mantle (muscle) of the main squid species in the diet of wandering albatrosses at South Georgia, Crozet
Kerguelen Islands
Taonius sp. (Clarke)
Taonius sp. B (Voss)
Histioteuthis atlantica small
10 15.2 ± 1 13.7−16.9
Histioteuthis atlantica Large
?Mastigoteuthis sp. A (Clarke)
10 13.6 ± 1 12.3−15.1
Martialia hyadesi
Taningia danae
Mar Ecol Prog Ser 530: 119–134, 2015
Table 6. Trophic level and δ15N of squid, crustacea and marine vertebrates sampled in previous studies in the Southern Ocean
Cherel et al. (2008)
Stowasser et al. (2012)
Cherel et al. (2008)
Prince Edward Is.
Kaehler et al. (2000)
Euphausia superba
Cherel et al. (2008)
Stowasser et al. (2012)
Stowasser et al. (2012)
Euphausia frigida
Stowasser et al. (2012)
Stowasser et al. (2012)
Cherel et al. (2008)
Cherel et al. (2008)
Stowasser et al. (2012)
Cherel et al. (2008)
Stowasser et al. (2012)
Cherel et al. (2008)
Stowasser et al. (2012)
Cherel et al. (2008)
Stowasser et al. (2012)
Cherel et al. (2008)
Cherel & Hobson (2005)
Cherel et al. (2008)
Cherel & Hobson (2005)
Martialia hyadesi
Cherel et al. (2008)
Cherel & Hobson (2005)
Cherel et al. (2008)
Cherel & Hobson (2005)
Cherel et al. (2008)
Cherel & Hobson (2005)
Cherel et al. (2008)
Cherel & Hobson (2005)
Stowasser et al. (2012)
Pauly et al. (1998)
Burns et al. (1998)
Zhao et al. (2004)
Hydrurga leptonyx
Hall-Aspland et al. (2005)
Zhao et al. (2004)
Anderson et al. (2010)
Stowasser et al. (2012)
Diomedea exulans
Anderson et al. (2010)
Jaeger et al. (2010)
Anderson et al. (2010)
Cherel et al. (2013)
Anderson et al. (2010)
Cherel et al. (2007)
Cherel et al. (2008)
Cherel et al. (2007)
Stowasser et al. (2012)
aAdélie Land; bCorrected (beak) values; cRaw (beak) values
Guerreiro et al.: Isotope values of Southern Ocean cephalopods
et al. 2000, Cherel et al. 2008, Stowasser et al. 2012).
subtropical waters (Altabet & François 1994, Jaeger
M. ingens (and M. knipo vitchi) had a similar niche to
et al. 2010). C. akimushkini had the highest mean
K. longimana (Table 5), which was also within the
δ15N value of all species, and there was a positive
expected range for a diet dominated by mesopelagic
relationship between individual size and δ15N in H.
fish (myctophids and paralepids, Table 6) (Cherel &
atlantica (Table 1, Fig. 7). This squid feeds higher in
Duhamel 2003).
the food chain as it grows and is able to feed on pro-
The cephalopods which had the lowest δ15N (apart
gressively larger prey. Thus, ontogenetic variation
from M. hyadesi and the onychoteuthids, Table 5)
has a potentially marked impact on δ15N values in
are likely to depend on zooplankton that feed in turn
histioteuthids as it does in other species of ommas-
on sinking organic matter, since the measured δ15N
trephids and onychoteuthids (Cherel & Hobson 2005,
values were higher than expected from organisms
Cherel et al. 2009a, Lorrain et al. 2011).
that, in some cases, are characterized by gelatinous
Even though the various squid species in this study
bodies and small size (except for Haliphron atlanticus,
showed significant intra-specific differences in their
Fig. 7), e.g. cranchiids (Collins & Rodhouse 2006).
niches across island groups, they generally remained
The sinking organic matter and detritus is generally
in the same relative positions within the respective
enriched in 15N as a consequence of microbial
cephalopod communities. The exception was ?Masti -
decomposition during the transport to depth, which
goteuthis sp. A (Clarke) which moved between the
richment in the whole food web
first group in Crozet to the second group in South
(including cephalo
pods) that is dependent on this
Georgia (Figs. 2, 3, 4 & 8).
resource (Michener & Kaufman 2007).
Overall, the squid that live in Antarctic and sub-
G. antarcticus presented the highest δ15N of all
Antarctic waters were secondary to tertiary con-
cephalopods in this study (apart from T. danae and
sumers, i.e. trophic level (TL) > 3, which is near the
the subtropical squids, Table 5). These high δ15N
average level for marine mammals (TL = ca. 4.0
values are just below those for the colossal squid
[Pauly et al. 1998]), penguins (TL = 3.4−4.0 [Sto
Mesonychoteuthis hamiltoni (Cherel & Hobson 2005,
wasser et al. 2012]) other seabirds (TL = 3.7−5.2 [Sto -
Cherel et al. 2008) (Table 6), which is considered a
wasser et al. 2012]), and sharks (TL > 4 [Cortés 1999])
top invertebrate predator (Cherel & Hobson 2005)
(Table 6). Furthermore, the range of isotopic niches
that feeds on large fish and squid, and is found in the
occupied by squid, and their wide horizontal and
diet of sperm whales Physeter macrocephalus and
vertical distribution, shows parallels with the niches
sleeper sharks Somniosus cf. microcephalus (Clarke
occupied by large pelagic fish (Rodhouse & White
1980, Cherel et al. 2004) (Table 6). This may probably
1995, Cortés 1999). Indeed, at depth, squid may be
be explained by a top predator position (by G.
competing for prey with large, deep-diving mammals
antarcticus) on a rather inefficient food web charac-
such as seals (Cherel et al. 2008). The most likely
terized by high 15N enrichment rates, dependent on
candidates for occupying the niche of large pelagic
heterotrophy of organic matter and detritus descend-
fish are the squids with the highest δ15N that do not
ing from epipelagic waters. As they are muscular
belong to the cranchiid or the mastigoteuthid/bato-
squid with well-developed hooks, which is a sign of
teuthid families, as the former are gelatinous and
an active predator among squid, this species is a can-
likely to be sluggish (Collins & Rodhouse 2006) and
didate for top predator within this environment (ac -
the latter probably depend on the benthos (Roper &
cording to the isotope data), despite their small size
Vecchione 1997); hence, the most active predators
relative to such megafauna as T. danae (Fig. 7) and M.
are presumably G. antarcticus, T. danae and M.
knipovitchi (Figs. 2–5).
T. danae is certainly one of the top predators
amongst the squid inhabiting the deep ocean (Cherelet al. 2009b), as it shows a nitrogen isotope ratio at
least as high as the giant squid Architeuthis dux, andwithin the range recorded in other studies (Cherel
In conclusion, our study emphasizes that cephalo -
& Hobson 2005, Cherel et al. 2009b) (Tables 5 & 6). T.
pods have a wider and generally more complex (but
danae can also reach a considerable size (Fig. 7),
well defined) pattern of distribution around the
with a maximum mantle length of 170 cm (Nesis
Southern Ocean than previously considered. Given
1987). The subtropical species Histioteuthis atlantica,
the large range of δ13C and δ15N values, cephalopods
mush kini and Taonius sp. (Clarke) had the
must occupy a diverse range of niches, from the mid-
highest δ15N, probably due to the high baseline in
dle of the food web (secondary consumers, TL = 3), to
Mar Ecol Prog Ser 530: 119–134, 2015
top predators (TL > 4) in all the different water
masses of the Southern Ocean. δ15N in our samples
ingens (Teuthoidea: Onychoteuthidae) in the upperslope waters of the Kerguelen Islands. Mar Ecol Prog Ser
corresponded broadly to those expected from previ-
ous conventional diet studies, or, with the exception
of Martialia hyadesi, were somewhat higher, sug-
predators: a new tool to study the trophic ecology of
gesting a greater representation of higher trophic
cephalopods, including giant and colossal squids. Proc RSoc B 272: 1601−1607
prey. Although particular squid varied in their iso-
topic niche depending on the sampling site (island
bon stable isotope signatures of marine predators: a tool
group), they did, however, occupy the same relative
to investigate their foraging areas in the Southern
position within each community, apparently consist-
Ocean. Mar Ecol Prog Ser 329: 281−287
ing of 3 main groups and one outlier (M. hyadesi).
Cherel Y, Klages N (1998) A review of the food of alba-
trosses. In: Robertson G, Gales R (eds) Albatross biology
The most active, muscular and best-armed (hooked)
and conservation. Surrey Beatty and Sons, Chipping
cephalopod species with the highest δ15N levels seem
Norton, Australia, p 113–136
likely to occupy the niche of a top predator in pelagic
ecosystems. Squid in general constitute a crucial and
marine resources: black-browed albatrosses feeding onommastrephid squids in Kerguelen waters. Mar Ecol
diverse component of Southern Ocean ecosystems,
Prog Ser 129: 295−300
as not only are they widespread and abundant prey
for marine top predators, but in addition, the meso-
teuthid squids in the southern Indian Ocean: new infor-
and bathypelagic species function as effective bio-
mation from seabird predators. Mar Ecol Prog Ser 188: 93−104
logical circulators by returning deep-sea carbon
back to the surface, and vice-versa. Finally, our study
subantarctic islands:
new information from predators.
demonstrates the value of new approaches for im
Mar Ecol Prog Ser 266: 143−156
proving our understanding of the role of cephalopods
in food webs, and in energy/carbon cycling in marine
isotopes document seasonal changes in trophic nichesand winter foraging individual specialization in diving
predators from the Southern Ocean. J Anim Ecol 76: 826−836
Acknowledgements. The authors thank fieldworkers for col-
Stable isotopes reveal the trophic position and mesopela-
lecting diet samples, Paul Rodhouse for numerous discus-
gic fish diet of female southern elephant seals breeding
sions on the paper and on cephalopods in general, Janet Silk
on the Kerguelen Islands. Mar Ecol Prog Ser 370:
for creating Fig. 1, and Alexandra Baeta for stable isotope
analysis. The work at Crozet and Kerguelen was supported
financially and logistically by the Institut Polaire Français
(2009a) Tissue, ontogenic and sex-related differences in
Paul Emile Victor (Programme N°109, H. Weimerskirch)
δ13C and δ15N values of the oceanic squid Todarodes fil-
and the Terres Australes et Antarctiques Françaises, and at
ippovae (Cephalopoda: Ommastrephidae). Mar Biol 156:
South Georgia by the British Antarctic Survey. This work
was also supported by the Fundação para a Ciência e Tec-
nologia (FCT), the British Antarctic Survey and within
topes document the trophic structure of a deep-sea
research projects CEPH, POLAR, PROPOLAR and inter
cephalopod assemblage including giant octopod and
national programs ICED and SCAR AnT-ERA. This study
giant squid. Biol Lett 5: 364−367
represents a contribution to the Ecosystems component of
the British Antarctic Survey Polar Science for Planet Earth
(2013) A comprehensive isotopic investigation of habitat
Programme, funded by the Natural Environment Research
preferences in nonbreeding albatrosses from the South-
ern Ocean. Ecography 36: 277−286
Clarke MR (1977) Beaks, nets and numbers. Symp Zool Soc
Lond 38: 89−126
Clarke MR (1980) Cephalopoda in the diet of sperm whales
of the Southern Hemisphere and their bearing on sperm
whale biology. Discov Rep 37: 1−324
topic ratio as a recorder for surface ocean nitrate utiliza-
Clarke MR (1983) Cephalopod biomass:
tion. Global Biogeochem Cycles 8: 103−116
predation. In: Stone DM (ed) Memoirs of the National
Museum of Victoria, Vol 44. Museums Board of Victoria,
ald RA, Bearhop S (2010) Element patterns in albatrosses
Melbourne, p 95−107
and petrels: influence of trophic position, foraging range,
and prey type. Environ Pollut 158: 98−107
cephalopods. Adv Mar Biol 50: 191−265
diet of Weddell seals in McMurdo Sound, Antarctica as
levels of sharks. ICES J Mar Sci 56: 707−717
determined from scat collections and stable isotope
analysis. Polar Biol 19: 272−282
do albatrosses catch squid? Antarct Sci 6: 155−162
Guerreiro et al.: Isotope values of Southern Ocean cephalopods
Nesis KN (1987) Cephalopods of the world (translated by B.
Southern Ocean. Deep-Sea Res 29: 1−15
S. Levitov and edited by L. A. Burgess). T. F. H. Publica-
tions, Neptune City, NJ
tribution of carbon isotopes in animals. Geochim Cosmo -
Park Y H, Gambéroni L, Charriaud E (1993) Frontal struc-
chim Acta 42: 495−506
ture, water masses, and circulation in the Crozet Basin.
J Geophys Res 98: 12361−12385
bution of nitrogen in animals. Geochim Cosmochim Acta
partitioning using stable isotopes: coping with too much
variation. PLoS ONE 5: e9672
(2011) Assimilation of upwelled nitrate by small eukary-
otes in the Sargasso Sea. Nat Geosci 4: 717−722
composition and trophic levels of marine mammals. ICES
J Mar Sci 55: 467−481
bon and nitrogen isotope analysis reveals seasonal varia-
tion in the diet of leopard seals. Mar Ecol Prog Ser 305:
(2010) Moving polewards in winter:
in the migratory strategy of a pelagic seabird? Front Zool
ine food webs using cephalopod beaks: new insight from
Rodhouse PG (1990) Cephalopod fauna of the Scotia Sea at
captively raised Sepia officinalis. Can J Zool 84: 766−770
South Georgia: potential for commercial exploitation and
possible consequences. In:
Kerry KR, Hempel G (eds)
trosses (Diomedea exulans L.) breeding at six circumpo-
Antarctic ecosystems:
ecological change and conser
lar localities. J R Soc N Z 22: 243−263
vation. Springer-Verlag, Berlin, p 289−298
(2007) Applying new tools to cephalopod trophic dynam-
ecological niche of epipelagic fish in the Antarctic Polar
ics and ecology: perspectives from the Southern Ocean
Frontal Zone. Biol Bull 189: 77−80
Cephalopod Workshop, February 2–3, 2006. Rev Fish
Biol Fish 17: 79−99
the cephalopod Martialia hyadesi (Teuthoidea: Ommas-
trephidae) at the Antarctic Polar Front, Scotia Sea. Mar
paring isotopic niche widths among and within com
Biol 114: 415−421
munities: SIBER — Stable Isotope Bayesian Ellipses in R.
J Anim Ecol 80: 595−602
others (1996) Cephalopods and mesoscale oceanography
at the Antarctic Polar Front: satellite tracked predators
(2010) Seabird satellite tracking validates the use of lati-
locate pelagic trophic interactions. Mar Ecol Prog Ser
tudinal isoscapes to depict predators' foraging areas in
the Southern Ocean. Rapid Commun Mass Spectrom 24:
Roper CFE, Vecchione M (1997) In situ observations test
hypotheses of functional morphology in Mastigoteuthis
(Cephalopoda, Oegopsida). Bull Mar Sci 71: 893−901
ture of the marine food web at the Prince Edward Islands
Sackett WM, Eadie BJ, Exner ME (1974) Stable isotope com-
(Southern Ocean) determined by δ13C and δ15N analysis.
position of organic carbon in recent antarctic sediments.
Mar Ecol Prog Ser 208: 13−20
In: Tissot B, Bienner F (eds) Advances in organic chem-
istry 1973. Editions Technip, Paris, p 661–671
study of avian and mammalian trophic ecology. Can J
MA, Pond DW (2012) Food web dynamics in the Scotia
Sea in summer: A stable isotope study. Deep-Sea Res II
Richard P, Cherel Y (2011) Sequential isotopic signature
along gladius highlights contrasted individual foraging
strategies of jumbo squid (Dosidicus gigas). PLoS ONE 6:
tion of the Antarctic Polar Frontal Zone to the north of
South Georgia in summer 1994. J Geophys Res 102:
Michener RH Kaufman L (2007) Stable isotope ratios as
tracers in marine food webs: an update. In: Michener RH,
Lajtha K (eds) Stable isotopes in ecology and en viron -
assimilation and export in naturally iron-fertilized waters
mental science. Blackwell publishing, Oxford, p 248−252
of the Southern Ocean from nitrogen, carbon and oxygen
Montoya JP (2007) Natural abundances of marine plank-
isotopes. Deep-Sea Res II 55: 820−840
tonic 15N. In: Michener RH, Lajtha K (eds) Stable iso-
Voss NA (1980) A generic revision of the Cranchiidae
topes in ecology and environmental science. Blackwell
(Cephalopoda; Oegopsida). Bull Mar Sci 30: 365−412
publishing, Oxford, UK, p 187−189
Voss NA, Nesis KN, Rodhouse PG (1998) The cephalopod
Nemoto T, Okiyama M, Takahashi M (1985) Aspects of the
Family Histioteuthidae (Oegopsida): systematics, biology,
roles of squid in food chains of marine Antarctic ecosys-
and biogeography. Smithson Contrib Zool 586: 293−372
tems. In: Siegfried R, Condy PR, Laws RM (eds) Antarctic
nutrient cycles and food webs. Springer-Verlag, Berlin,
13C abundances in the Antarctic Ocean with emphasis on
the biogeochemical structure of the food web. Deep-Sea
Nemoto T, Okiyama M, Iwasaki N, Kikuchi N (1988) Squid
Res 34: 829−841
as predators of krill (Euphausia superba) and prey for
Weimerskirch H, Salamolard M, Sarrazin F, Jouventin P
sperm whales in the Southern Ocean. In:
(1993) Foraging strategy of wandering albatrosses
(ed) Antarctic Ocean and resources variability. Springer-
through the breeding season:
a study using satellite
Verlag, Berlin, p 292−296
telemetry. Auk 110: 325−342
Mar Ecol Prog Ser 530: 119–134, 2015
Xavier JC, Cherel Y (2009) Cephalopod beak guide for the
ation in the cephalopod component of the diet of the
Southern Ocean. British Antarctic Survey, Cambridge
wandering albatross, Diomedea exulans, breeding at
Bird Island, South Georgia. Mar Biol 142: 611−622
do larger albatrosses eat bigger squid? J Zool (Lond) 271:
Rodhouse PG (2004) Foraging ecology and interactions
with fisheries of wandering albatrosses (
Diomedea exu-
Geographical Information System (GIS) atlas of cephalo-
lans) breeding at South Georgia. Fish Oceanogr 13:
pod distribution in the Southern Ocean. Antarct Sci 11:
effective method for assessing the proportions of cepha -
ing strategies and diets of breeding grey-headed and
lo pods in the diet of albatrosses. Auk 122: 1182−1190
wandering albatrosses at South Georgia. Mar Biol 143:
interactions of Antarctic seals as determined by stable
Xavier JC, Croxall JP, Trathan PN (2003b) Inter-annual vari-
isotope signatures. Polar Biol 27: 368−373
Editorial responsibility: Edward Durbin,
Submitted: January 10, 2014; Accepted: March 2, 2015
Narragansett, Rhode Island, USA
Proofs received from author(s): June 7, 2015
Source: http://www.cebc.cnrs.fr/publipdf/2015/GMEPS530_2015.pdf
oroboros.at
Bioscience Reports, Vol. 25, Nos. 5/6, October/December 2005 (Ó 2005)DOI: 10.1007/s10540-005-2897-2 Cytochrome c Effect on Respiration of Heart Mitochondria:Influence of Various Factors Adolfas Toleikis,1,2 Sonata Trumbeckaite,1 and Daiva Majiene1 The effect of exogenous cytochrome c on respiration rate of the rat and human heartmitochondria was assessed in situ, using permeabilized fibers. It was (i) much more pro-nounced in State 2 and 4 than in State 3 with all the respiratory substrates (pyru-vate+malate, succinate, palmitoyl-CoA+carnitine and octanoyl-L-carnitine), (ii) differentwith different substrates, (iii) much higher after ischemia in both metabolic states, partic-ularly in the case of succinate oxidation compared to pyruvate+malate, (iv) the highest inState 4 with succinate as a substrate. Similar results were obtained with the isolated rat andrabbit heart mitochondria. The differences in the degree of stimulation of mitochondrialrespiration by cytochrome c and, thus, sensitivity of cytochrome c test in evaluation of theintactness/injury of outer mitochondrial membrane are probably determined by the differ-ences in the cytochrome c role in the control of mitochondrial respiration in the above-described conditions.
wjmer.co.uk
Varenicline and Depression: a Literature Review Dr Eugene YH Yeung; Dr Beverly L Bachi; Dr Shann Long; Dr Jessica SH Lee; Mr Yueyang Chao August 2015 Doctors Academy Publications Varenicline is the most effective smoking cessation monotherapy medication. Pre-marketing trials excluded participants with psychiatric disorders. This literature review investigated the effects of varenicline among patients with depression