Skagen global status report september 2014


SKAGEN Global
Status Report February 2015
Summary – February 2015
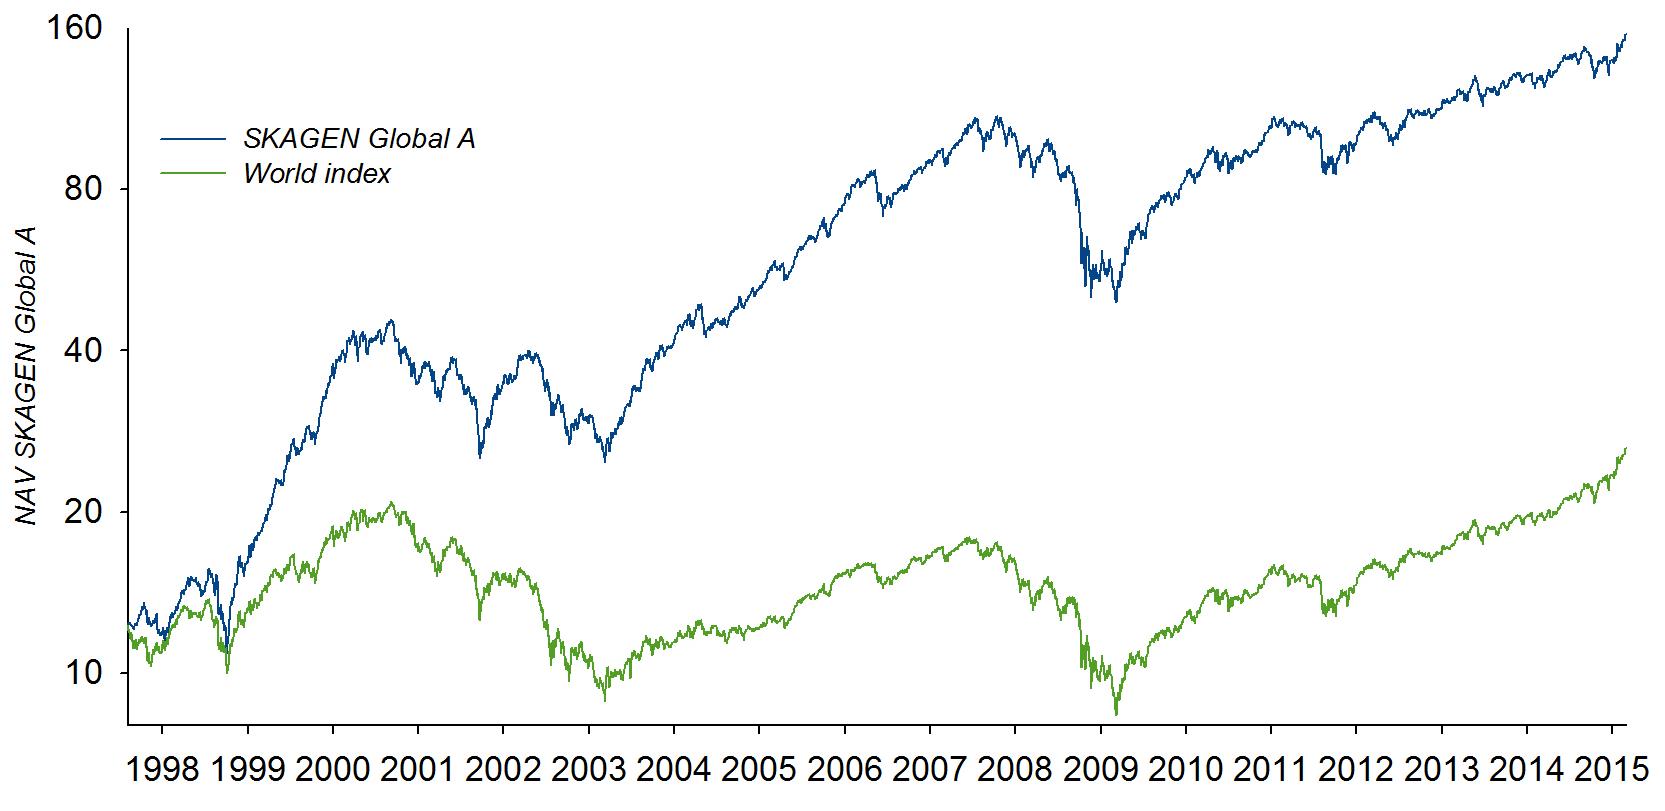
• SKAGEN Global outperformed its benchmark in February. The fund's unit price increased by
6.9% whereas the benchmark MSCI All Country World Index increased by 5.8% (both measured in EUR).*
• Citigroup, Renault and AIG were the three best monthly contributors to absolute performance
while Samsung Electronics, Global Telecom Holding and State Bank of India were the three main detractors.
• The SKAGEN Global team continued to hunt for new ideas and fine-tune existing portfolio
holdings. As a result, we initiated three new positions in General Electric (GE), Lundin Petroleum and Columbia Property Trust.
• We increased our weight in NN Group and DSM but scaled back in Toyota Industries,
Renault and Technip. The oil services companies Baker Hughes and Weatherford exited the portfolio.
• SKAGEN Global's portfolio remains attractively valued both on an absolute and a relative
basis. The fund's top-35 holdings trade at a weighted Price/Earnings (2015e) of 10.8x and a Price/Book of 1.2x vs. the index at 16.7x and 2.1x, respectively. Hence, the discount of the portfolio to the index is significant on both multiples.
* Unless otherwise stated, all performance data in this report relates to class A units and is net of fees.
SKAGEN Global A results, February 2015
EUR, net of fees
February
inception*
MSCI AC World Index*
Note: All returns beyond 12 months are annualised (geometric return) * Inception date: 7 August 1997 ** Benchmark index was MSCI World in NOK from 7 August 1997 to 31 December 2009 and MSCI All Country World Index from 1 January 2010 onwards
Annual performance since inception (%)*
SKAGEN Global A has beaten the benchmark 14 out of 18 years
SKAGEN Global A (EUR)
MSCI AC World** (EUR)
Note: All figures in EUR, net of fees * Inception date: 7 August 1997 ** Benchmark index was MSCI World in NOK from 7 August 1997 to 31 December 1997 and MSCI All Country World Index from 1 January 2010 onwards
Markets in February in EUR (%)
SKAGEN Global A
MSCI AC Index
China (Hong Kong)
MSCI EM Index
Main contributors February 2015
Largest positive contributors
Largest negative contributors
NOK M illions
NOK M illions
##### Samsung Electronics
##### Global Telecom Holding
American International Group
##### State Bank of India
##### Hyundai Motor
##### Norsk Hydro
##### Tata Motors
China Unicom Hong Kong
##### Roche Holding
##### Varian Medical Systems
##### Yazicilar Holding
Value Creation MTD (NOK MM):
NB: Contribution to absolute return
Main contributors QTD 2015
Largest positive contributors
Largest negative contributors
NOK M illions
NOK M illions
China Unicom Hong Kong
2E+08 Hyundai Motor
2E+08 KazMunaiGas
Cheung Kong Holdings
1E+08 Koninklijke DSM
9E+07 Lundin Mining
HeidelbergCement
9E+07 Storebrand
8E+07 Microsoft Corp
8E+07 Petroleo Brasileiro
Value Creation QTD (NOK MM):
NB: Contribution to absolute return
Holdings increased and decreased during February 2015
Key buys in February
Key sells in February
We have further downgraded our outlook for the
We initiated a new position in General Electric (GE)
oil service sector and therefore chose to exit our
which has significantly underperformed peers over the
positions in Baker Hughes and Weatherford.
past few years. The company is now at an attractive
valuation and with clear catalysts for a revaluation.
Several holdings have had a good start to the
See factsheet at the end of the report.
year and we have locked in some of the gains in
stocks that have performed well, such as
Lundin Petroleum is a new position in the fund. We
Renault, Toyota Industries and Technip.
find the company to be undervalued as the consensus
valuation of Lundin s stake in the Johan Sverdrup field
We also slightly trimmed our positions in
is considerably lower than our estimate of the fair
Gazprom and Vimpelcom to allocate capital to
value. See factsheet at the end of the report.
more attractive opportunities elsewhere.
Columbia Property Trust (CXP) entered the portfolio
as a new position. CXP is a US real estate investment
trust (REIT). This is a relatively unknown company; a self-help story that trades at an attractive discount to NAV, which we think should turn into a premium to NAV over the next 2-3 years.
Shares in DSM declined on downgrades driven by the
Nutrition division's Swiss cost base after the Swiss
National Bank removed the CHF peg to the EUR. We
see some short-term headwinds, but it is also a buying
opportunity and we have thus added to our position.
The majority owner of the Dutch insurer NN Group
conducted a placement of shares and we used the
opportunity to increase our stake.
Most important changes Q1 2015
Holdings increased
Holdings reduced
• General Electric (new)
• Mosaic (out)
• Lundin Petroleum (new)
• Rec Silicon, incl. convertible (out)
• Columbia Property Trust (new)
• Baker Hughes (out)
• Weatherford (out)
• Lundin Mining
• Toyota Industries
• Samsung Electronics
Largest holdings in SKAGEN Global as of 27 February 2015
SAMSUNG ELECTRONICS
STATE BANK OF INDIA
Weighted top 10
Weighted top 35
MSCI AC World
Sector and geographical distribution versus index (Feb 2015)
Geographical distribution
Sector distribution
Frontier Markets
Consumer discretionary
Consumer staples
Banking & Finance
Due to rounding, figures may not always add up to 100
Key earnings releases and corporate news, February 2015
Overall, Q4 numbers indicate things are moving in the right direction
Summary: While headline EPS slightly missed expectations, the underlying numbers showed clear progression in many areas.
Implications for investment case: Insurance results can be tricky to assess at first sight given the complexity of the business. Once the market looked beyond the headline numbers it became clear that the result was fairly decent and on the right track. The company is now showing improvements in line with our investment thesis. In sum, these results further increase our conviction in the case and at 0.7x book value, AIG deserves to be a top-3 position in SKAGEN Global.
Dividend and guidance up
Yamaha Motor
Summary: Net income for FY2014 rose 55% from a year ago and beat analyst estimates. The dividend was raised and is now 53% higher than the previous full-year dividend. The guidance for sales and operating profit
was also slightly ahead of estimates. Several new motor cycle models are in the pipeline and ready for launch in developed markets and will further boost growth. The stock gained on the results and outlook. Implications for investment case: A particularly strong US market combined with the weak yen helped Yamaha Motor lift guidance. So far, good results in the developed markets have boosted the share price and current conservative guidance indicates this leg remains on track. In addition, the emerging market story is still subdued but would provide at least another 20% increase in the share price fair value.
New CEO outlines plans for Gap comeback
Summary: The company delivered earnings more or less in line with expectations. The important part of the
earnings release is that the new CEO, Art Peck, made his debut on the conference call after the numbers were published. He seeks to turn the company around and has already implemented changes to the organisation. Implications for the investment case: Turning the Gap brand around will take time but it has the full attention of the management. The diversified retailing model with one brand s success helping to offset another s weakness supports the value. Gap continues to buy back shares, has good cash flow and the balance sheet is rock solid. We see further share buybacks in the years to come. Using 10 year s average price earnings multiple of 15x and EPS of USD 3.3 for 2017 gets us to a target price of USD 50.
Key earnings releases and corporate news, February 2015 (cont.)
Q3 numbers in line with expectations
Toyota Industries
Summary: Toyota Industries reported Q3 operating profit up roughly 25% from a year earlier. This was in line with expectations. The two main factors behind the YoY growth were good order intake for forklifts and a
weaker Japanese yen. Management retained full-year guidance for operating profit. Implications for investment case: There were no surprises and the results do not alter our investment case. Management is known for giving conservative guidance, so there is room for positive surprises. The strong forklift business development is positive and a key part of our investment thesis. The company, and the share price, has also benefitted from a 6% stake in Toyota Motor, which has seen a steady increase in market value over the past few months. Our JPY 6,200 price target is under review.
Solid outlook for 2015
Lundin Mining
Summary: With volumes already having been reported, cost was the main unknown in the Q4 report. Costs came in slightly above expectations. In addition, there were a few one-offs but overall things seem to be
progressing well. The Eagle mine ended 2014 with higher-than-expected production. The guidance for capital expenditure was reduced by 15% for 2015 and cash costs will likely come down as they are based on currency exchanges 12-16% above current spot prices. Implications for investment case: With both the Candelaria and Eagle mines running at full speed in 2015 we would expect the EPS to double from 2014 to 2015. The Tenke mine will contribute less cash for 2015 as metal prices are down and some investments will be made to expand the operations. We see plenty of upside for this stock but it could be a bumpy ride.
Decent Q4 results
Summary: Revenues were just above expectations, but margins came in slightly below as new product launches in 2015 will drive up SG&A costs. The company sees 5-6% EPS growth in 2015, which is somewhat ahead of
expectations. Diabetes revenues to stay flat according to initial estimates - the US diabetes market for Sanofi has
been stable over the past two months. Sanofi expects to announce a new CEO by the end of Q1. Implications for investment case: The market is worried about Lantus in the US and the lack of a CEO. Sanofi will need to see some success with new products as the Lantus franchise gradually becomes less profitable. We are not expecting a steep, sudden drop-off in sales of Lantus but recognise the threat from generics. We expect the company to attract a highly competent CEO to restore investor confidence, which is still suffering after multiple profit warnings in 2013. Sanofi trades at 14.8x 2016 P/E vs. peers at 16-17x.
Key earnings releases and corporate news, February 2015 (cont.)
Comfortably exceeding guidance
Heidelberg
Summary: Q4 sales up 6.4% from a year earlier and better than consensus. Growth driven by all regions except Europe. The boost came from North America and Asia Pacific. The report completed a strong 2014 for
Cement (2.0%)
Heidelberg, well ahead of company guidance. Heidelberg expects positive macroeconomic developments in key markets (US, UK, Africa and Asia), tailwinds from commodity prices and the depreciating euro to offset weakness in Eastern Europe for 2015. Implications for investment case: Heidelberg continues to offer the highest earnings growth of the big cement companies thanks to its significant exposure to the US and UK. Heidelberg s main exposure to emerging markets is through Indonesia, where we see stable-to-better pricing going forward. We expect management to focus on returns and increasing cash-payouts to shareholders going forward.
2H 2014 a big confidence boost
Summary: Very strong numbers which were better than expectations. The good results came despite very weak conditions in Russia and Brazil, and 2H being the low point of Renault s model cycle. The company has been
improving margins through cost cutting measures. Despite the headwinds from emerging markets, Renault
management is still guiding for higher revenues, higher operating margin and positive free cash flow from autos for 2015 and this is pushing consensus estimates higher. Implications for investment case: With Renault being able to weather the headwinds from emerging markets, analysts are becoming more optimistic. Management's upbeat tone suggests better sales and continued strong cash flow to come. New product launches for both Renault and Nissan will be a tailwind for the second half of 2015 and into 2016. The cost savings from the Nissan platform-sharing agreement will become visible in 2016. Stock price has had a nice 55% bounce since the low in mid-October (EUR 50) and we have trimmed the positions slightly. Still, there is room for the stock to go even higher.
Very strong PC margins and Motorola momentum
Summary: Result was significantly better than expected given the drag from newly acquired (loss-making) businesses. Lenovo continues to deliver on its margin targets. The company has become a much more
diversified company both in terms of geography and products. Growth through acquisitions arguably warrants
lower multiples than organic growth, but the market currently gives little value to mobile and enterprise segments. Implications for investment case: Lenovo's core strength is efficiency, which it has proven in PCs and is now on track to repeat in mobile and servers. The business model has high operating leverage, so severe slowdown in key markets remains a meaningful risk to earnings.
Key earnings releases and corporate news, February 2015 (cont.)
Q4 results highlight solid fundamentals in Cable and NBCU
Summary: The results were broadly in line with expectations on all key financial metrics and subscriber fundamentals continue to improve. Total cable revenue and EBITDA were better and programming expenses
lower than expected. The company signalled share buybacks worth USD 4.25bn in 2015 with an additional USD 5bn or more after the TimeWarner Cable deal is done. Dividend was raised 11% to USD 1/share. Implications for investment case: Comcast continues to execute well despite some focus on closing the deal with TimeWarner Cable. Subscriber growth continues with increased average revenue per user. The NBCU unit has turned a corner and may perform better. Buybacks and raised dividend signal a confident management team. There should be room to increase the share buyback beyond USD 5bn in 2015.
Q4 report shows self-help story ticking along, but volumes remain low
Akzo Nobel
Summary: Sales roughly in line with expectations. Europe and Latin America posted weak volumes. The results came with some one-off write-downs, but overall they were decent. It was the sixth consecutive quarter
that Akzo posted underlying margin improvement, supporting the long-term self-help story. On the negative
side, volumes continue to be low, but this is where the story has room for improvement. Implications for investment case: A pick-up in demand from the automotive and construction sectors would help lift volumes up from currently depressed levels. We believe the 2015 targets are conservative and lower raw materials cost could be a tailwind. The pension deficit remains a question mark.
Good progress within trucks; construction equipment in the ditch
Summary: Sales were in line with consensus. Volvo shipped 9% less trucks in Q414 vs. Q413 and organic sales fell 2% adjusted for currency. Lower sales on a relatively high fixed cost base is never a good mix but
the truck margin improved 30bpp to 6% as cost cutting filtered through to the bottom line. Volvo got orders for 61,222 trucks - 7% more than consensus estimates. The biggest disappointment was construction equipment where volumes collapsed. The company is now addressing the problems by cutting production. Implications for investment case: Weak numbers in construction equipment should not come as a surprise and the company will not build huge inventories as manufacturing has been cut. However, it will take some time to turn construction equipment around. We continue to believe in the investment case.
Key earnings releases and corporate news, February 2015 (cont.)
Results in line with slightly better outlook provides some relief
Summary: Sales ahead of consensus and EBITDA in line with expectations. Human Nutrition continues to be a drag on Group performance, while Animal Nutrition remains robust. The main reason for the
disappointing Human Nutrition sales is volume pressure in the US supplement and Omega-3 markets as well as lower prices. The more cyclical, lower-margin Performance Materials and Polymer Intermediates businesses surprised on the upside, more than offsetting the weakness in Nutrition. Cash generation was good and balance sheet remains solid. DSM aims to deliver 2015 EBITDA "slightly ahead of 2014" which was a touch better than most analysts expected. There was no significant update on the potential disposal of the Polymer Intermediates business. Implications for investment case: DSM s transformation story continues. In 1995, DSM had no Nutrition business and by 2000 the segment made up less than 5% of revenues. Today it makes up 47% of revenues and 72% of EBITDA and the segment is relatively high margin (around 20%). The transformation has been achieved by spending EUR 2.8bn on acquisitions. We continue to believe that the valuation gap vs. other clean nutrition companies is too high and should narrow as we see DSM s Nutrition business pick up. Although we might not see a swift recovery, DSM could implement further measures to preserve margins and grow sales.
Q4 results support cash flow and capital focus
Summary: NN Group reported fairly strong numbers across the board. It also had good solvency on all measures. The most important piece of information from the report was the solid solvency ratio combined
with the dividend hike which signals confidence in the balance sheet. Implications for investment case: The signals are particularly important for Dutch insurers given the harsh treatment by the Dutch regulator. In other words, if there were any doubts about the robustness of the balance sheet, we believe NN Group would not be in a position to propose this level of capital return given the challenging external environment. In our investment case, NN Group is a capital return story and therefore the message in this quarterly update is reassuring. ING still owns nearly 70% of NN Group but has to sell down its stake below 50% by the end of 2015.

The largest companies in SKAGEN Global
Citi is a US financial conglomerate with operations in more than 100 countries worldwide. The bank was bailed out by the US government during the credit crisis and subsequently raised USD 50bn of new capital. Consists of two units: Citi Holdings which is a vehicle for assets that are to be run down and sold and Citi Corp which is the core of the going concern business. In Citicorp 60% of revenues are derived from outside the US - mainly from emerging markets.
Samsung Electronics is one of the world's largest producers of consumer electronics. The company is global #1 in mobile phones and smartphones, the world's largest in TV and a global #1 in memory chips. Samsung also produces domestic appliances, cameras, printers, PCs and air conditioners.
AIG is an international insurance company serving commercial, institutional and individual customers. The company provides property-casualty insurance, life insurance and retirement services. AIG was at the very centre of the financial crisis as the central bank for mortgage insurance – it was bailed out in a USD 180bn bail out. The company has two core insurance holdings: Sun America and Chartis that it intends to keep. The company has set a target to achieve 10% ROE by 2015.
Nordea holds pole position in the Nordics with 11.2m retail costumers and 625,000 corporate clients. Nordea is the largest Nordic asset manager/wealth manager with EUR 224bn in AuM (EUR 138bn in managed funds). It is the most diversified among its Nordic peers. Total loans are EUR 346bn with the following split: Finland 27%, Sweden 26%, Denmark 24%, Norway 18%, and Baltics/Poland/Russia 5%.
DSM is a global life sciences and materials science company. It was founded in 1902 and is headquartered in Heerlen, the Netherlands. The company operates in five segments: nutrition, performance materials, polymer intermediates, pharma, and an innovation centre. DSM has spent a decade reshaping its businesses from basic chemicals to life science. 2/3 of earnings comes from nutrition today.
The largest companies in SKAGEN Global (cont.)
LG Corp is the third largest conglomerate in Korea. It is a holding company which operates a number of listed subsidiaries: LG Chem (basic chemicals but it is also a leading manufacturer of batteries), LG Electronics (consumer electronics and home appliances), LG Uplus (wireless telecom services), and LG Household & Health (households and personal care products). The company also operates a number of unlisted companies.
Akzo Nobel is the world's leading coatings supplier. It is active in 3 key areas: Performance coatings, Decorative paints and Specialty chemicals. Revenues in 2013 totalled USD 14.6bn with 50,000 employees. The company has good positions in all key mature markets plus a particularly strong emerging market portfolio, including top 3 positions in China, India and Brazil. High growth markets make up 44% of sales, with North America representing 15% and developed Europe 38%.
General Motors is one of the world's largest automakers with a global market share of 11% and its products are sold in 120 countries. Brands include: Buick, Cadillac, Chevrolet, GMC, Daewoo, Holden, Isuzu, Jiefang, Opel, Vauxhall and Wuling. North America is still its largest market, making up more than 50% of revenues. However, General Motors has a strong presence in BRIC with a market share of 12% together with joint venture partners.
State Bank of India is the largest bank in India with a 22% market share. It has an unrivalled pan-India branch network and a very strong deposit franchise. The bank also has a sizeable overseas presence (15% of loan book). Aside from its core banking operation, the company is also involved in life insurance, asset management, credit cards, and capital markets.
Roche is a leading pharmaceuticals and diagnostics company based in Switzerland. Half of group sales and 2/3 of EBIT are derived from the company's Big 3 oncology franchises: HER2 (breast cancer), Avastin (colorectal cancer), and MabThera/Rituxan/Gazyva (blood cancer), each about USD 7bn of revenue. These businesses all come from Genentech, in which Roche has been a majority owner since 1990, and bought the last 46% in 2009.
Special situation
General Electric (GE US) $25
History and what they do. Source of investment idea
• GE was founded in 1892 by Thomas Edison et al. Operating two divisions (GE Industrial, GE Capital) with 50/50
of earnings, it is the world's 10th largest publicly-traded company and boasts the 6th most valuable brand. GE Industrial is a play on global infrastructure with a high-margin service business and a large installed base.
Key Figures
• Group financials (2014): $150bn Sales, 12% operating margin, $13bn FCF, ND/EBITDDA 0
• Geographical sales split: US 45%, Asia 20%, Europe 20%, Other 15%
• GE Industrial: 6 segments (% Group Sales / operating margin): (i) Power & Water 19%/ 20%; (ii) Aviation
16%/20%; (iii) Healthcare 12%/17%; (iv) Oil & Gas 13/14%; (v) Transportation 4%/20%; (vi) Other 5%/4%
• GE Capital: 5 segments spanning commercial leasing, real estate and consumer financing. Classified as a non-
bank SIFI, but its 11% CT1 ratio vastly exceeds 7% minimum regulatory requirement.
• CEO (2000): J. Immelt (b. 1956), $50m shares; CFO (2013): J. Bornstein (b. 1966), $30m shares
• Investment idea derived from SKAGEN Global internal proprietary research
Rationale for investment
Our differentiated view on GE is particularly pronounced in three areas: Strategy, Incentives and Valuation skew.
1.Portfolio transformation. The market doubts GE's 2017 target of 75% of EPS from GE Industrial, but we believe
this aspiration is achievable and over the next 3 years will earn GE a higher, industrial-like valuation multiple reflecting growing and more resilient cash flows as the impact of today's bank-like GE Capital fades.
2.Management incentives. We think the power of the revamped incentive program lends credibility to the overall
strategy and strengthens alignment with shareholders. What gets measured, gets done.
3.After a multi-year US bull market, the valuation skew offered by GE looks fairly attractive with a relatively limited
downside supported by an attractive 3.5% yield and clear upside optionality driven by a self-help story. GE now trades at the highest relative P/E discount vs. the S&P in over 10 years (ex-financial crisis).
Largest Holders
1. Blackrock 5.7%
2. Vanguard 5.4%
Financial evidence that GE Industrial will comprise 75% of EPS and achieve 17+% operating margin in 2-3 years
3. State Street 4.1%
Synchrony (part of GE Capital) spin-off executed (faster than anticipated would be a bonus)
• More efficient use of balance sheet
Risks
• Strong $, integration issues (Alstom) and/or poor execution delaying the margin expansion in GE Industrial
• Interference from Federal Reserve on GE Capital "shrinking", potentially impeding the portfolio transformation
Target price
Our 2-year price target of $34 is derived from 15x 2018 EPS + dividends
Special situation
Lundin Petroleum (LUPE SS) SEK 118
History and what they do
The Lundin family have been involved in oil exploration and production for more than 30 years. LUPE can trace its roots back to the early eighties in the form of International Petroleum.
Market cap: SEK 36,8bn
Today LUPE has exploration and production assets focused upon two core areas, Norway and SE Asia, as well as assets in France, Netherlands and Russia. Lundin maintains an
exploration focus, seeking to generate shareholder value through exploration success and also
No. of shares: 311mn
has the resources to take exploration successes through to the production phase.
Rationale for investment
Total production of 30-35k boe/day, increasing to 75k boe/day year end 2015 when Edvard
ROE (16-17e): 30%
Grieg starts production. Main assets: Sverdrup (20-23% ownership, Statoil 40%, Petoro 15%,
DetNor 12% and Maersk 8%), Edvard Grieg (50% ownership, OMV 20%, Statoil 15% and
Wintershall 15%). Other assets include Alvheim (15%), Volund (35%), Brynhild (90%), France and some small assets in Netherlands, Indonesia and Russia. Sverdrup (500 mill boe) and
Edvard Grieg (100 mill boe) represent about SEK 140 per share. Total discoveries have a core
with Hold/Sell 15
NAV of SEK 170-200. LUPE is fully funded for its developments. Given Lundin's track record,
we expect to see more exploration successes in the years to come.
Triggers
Lundin family 30%
• Asset spin-offs probably on the agenda
Causeway Capital 3.8%
• Significant Sverdrup upside
• Marathon's announced farm-out of NCS will provide mark-to-market valuation of LUPE's
Risks
• Delayed production start on Sverdrup (first oil expected in 2019)
• Oil price
• Exploration successes coming to an end
Target price
SEK 175 derived from $10 x reserves.
For more information please visit:
Our latest Information on on our web pages
Unless otherwise stated, performance data relates to class A units and is net of fees.
Historical returns are no guarantee for future returns. Future returns will depend, inter alia, on market developments, the
fund manager's skill, the fund's risk profile and subscription and management fees. The return may become negative as
a result of negative price developments.
SKAGEN seeks to the best of its ability to ensure that all information given in this report is correct. However, it makes
reservations regarding possible errors and omissions. Statements in the report reflect the portfolio managers' viewpoint
at a given time, and this viewpoint may be changed without notice. The report should not be perceived as an offer or
recommendation to buy or sell financial instruments. SKAGEN does not assume responsibility for direct or indirect loss
or expenses incurred through use or understanding of the report. Employees of SKAGEN AS may be owners of
securities issued by companies that are either referred to in this report or are part of the fund's portfolio.
Source: https://www.skagenfunds.is/globalassets/pdfs/status-reports/international/skagen-global/2015/SKAGEN-Global-February.pdf
Xyz company
FLEXIBLE BENEFIT PLAN EMPLOYEE GUIDE NEW HORIZONS REGIONAL EDUCATION CENTERS © Copyright 2013 - Flexible Benefit Administrators, Inc. TABLE OF CONTENTS FLEXIBLE BENEFIT PLAN: THE BETTER YOU PLAN, THE MORE YOU SAVE! It's more than a slogan. The Flexible Benefit Plan is a real solution to issues facing all of us. Simply stated, by taking advantage of tax laws, the Flexible Benefit Plan works with your benefits to save you money. Your insurance programs are designed to help you and your family become financially secure as well as to protect you against the high cost of medical care including catastrophic events. However, almost everyone has a number of necessary, predictable expenses that are not covered by your insurance programs. The Flexible Benefit Plan will help you pay for these predictable expenses. The Flexible Benefit Plan offers a unique way to help pay for some of your health care expenses and dependent care expenses. The key to the Flexible Benefit Plan is that your eligible expenses are paid for with Tax Free Dollars. You will not pay any federal, state or social security taxes on funds placed in the Plan. You will save between, approximately, $27.65 and $37.65 on every $100 you place in the Plan. The amount of your savings will depend on your federal tax bracket. Using the Flexible Benefit Plan can save you a significant amount of money each year, however, it is important that you understand how the Plan works and how you can make the most of the advantages the Flexible Benefit Plan offers. This handbook will help you understand the Flexible Benefit Plan. The handbook covers how the Plan works, describes the categories of the Plan, explains the rules governing the Plan, the reimbursement process and how you can elect to participate in the Flexible Benefit Plan. Prior to electing to participate in the Flexible Benefit Plan, it is important that you read and understand the Rules and Regulations section of this handbook. After you read this material, if you have any questions please feel free to contact Flexible Benefit Administrators, Inc. at (757) 340-4567 or (800) 437-FLEX.
Doi:10.1016/j.pestbp.2008.01.007
Available online at www.sciencedirect.com Biochemistry & Physiology Pesticide Biochemistry and Physiology 91 (2008) 90–95 Warfarin resistance in Rattus losea in Guangdong Province, China Jianshe Wang a, Zhiyong Feng b, Dandan Yao b, Jingjing Sui b, Wenqin Zhong a, Ming Li a, Jiayin Dai a,* a Key Laboratory of Animal Ecology and Conservation Biology, Institute of Zoology, Chinese Academy of Sciences, Datun Road, Beijing 100101, PR China