Microsoft word - corn-milling-052503.doc

CORN FOR FOOD & FIBER
GLOBAL CORN AND Global experience in consulting in the areas of cereal and legume
processing.
STARCH CONVERSION
DRY CORN MILLING: Flour, Grits, Masa.
COSULTING SERVICES WET CORN MILLING: Starch, Sweeteners, Polyols, organic acids, amino
acids, specialty food ingredients and oxychemicals for synthetic polymers.
Triveni P. Shukla
Description
During the last 18 years of my consulting practice I have directly
consulted with 8 dry corn milling, 3 corn masa manufacturing companies, and 14 wet corn milling companies around the world. I
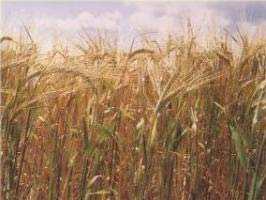
Corn Crop in the Field Field
was instrumental in privatizing Mexican governments 2,500 tons a day
(combined six plants) Miconsa operations and creating a no-waste
processes via extrusion on one hand and scaled in lime cooking and
fluid-bed drying and milling on the other. Also, I put together start-up
packages for three dry corn milling operations, a 500 ton per day wet
milling plant business plan, two new and cost effective processes for
starch modification, and an extensive process audit of a major corn wet mill in India. I am a firm believer in the high, long-tem value of corn
and its derivative for sustainable food supply and for the growth of its
food and industrial sub-sectors. The sum total of the preceding
combined with my experience as "NEW USES" consultant for the US
GRAIN COUNCIL prompted me to prepare this brief state-of-the-art
summary for all interested parties.
Sources: web sites of International Starch Institute, USDA and FAO
reports, a number of publications on the internet in the area of
"chemicals from corn", public domain reports of EU commission and
Agriculture Canada, and my own market surveys in Asia Pacific,
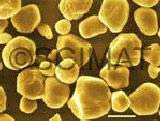
Corn Starch Granule
India, and Mexico.
THE GLOBAL CORN WET MILLING
The global corn wet milling industry has had a spectacular growth during the past two decades. From 18.oo million MT per year corn and other raw material utilization in 1980, the production volume grew to 35.00 million MT in 1997. It has now reached 70.00 million MT (2002). Over the years, corn has bean the major source of starch followed by potato, cassava (tapioca), wheat, and minor level of rice. The ratio of Starch and Sweetener stayed at 20:80 but during the last ten years production of industrial
alcohol in US has changed this ratio dramatically. The
production of specialty chemicals will tilt this ratio much
more from native and modified starches to specialty
chemicals for food, feed, and fiber. The tonnage of the
latter may grow from today's 11-12 million MT to 15-20
CORN FOR FOOD & FIBER
Description
million Mt by year 2010.
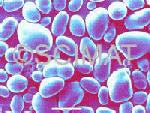
Potato Starch Granule
Current world production of corn is around 600 million MT with an approximate farm-gate value of $70.00 billion/year. Demand trends indicate that this figure will rise to 90.00 million MT owing mostly to economic expansion in the newer economies of Brazil, China, India, Indonesia, and the Eastern Europe. Vertical integration of corn processing industries is already a norm and it will continue in line with biotechnology developments. Corn does and will continue to play a major role both in traditional food and feed segments of our economy because of the lower cost of production of starch. Costs of starch production in EU are $75.00, $125.00, and $ 225.00 per MT respectively in
case of wheat, corn, and potato respectively. Growth will
come from specialty starch and chemicals production from
Per 1997 Data Source
corn, wheat, sorghum, oat, and other cereal grain starches. Corn chemicals include polyols, isocorbide, lactic acid, succinic acid, amino acids (lysine, glutamic acid), xanthan gum and others. Very much like wheat starch in Europe, large-scale starch production and conversion from other specialty grains is possible but for the cost structure and chemicals from corn may affect our macroeconomic order in ways difficult to assess now. There is long-term positioning in the making in case of fibers. EU is after Heavenly Silk from cellulosics, Japan wants it from milk proteins, and China is after soybean protein. US is unique in planning a long-term $30.00 billion investment for the
production of specialty chemicals from corn starch and
GLOBAL DRY CORN MILLING
On the dry corn milling side, corn masa based chips are just as common in Australia, Canada, Europe, and US as in Mexico and South America. Both traditional dry milled flour and grits and lime cooked, corn masa flour will grow globally in line with the growth of beverage and convenience foods in general.
EXPORT MARKET COMPETITION
Brazil may join US, Argentina, and S. Africa as an
additional exporter as the current world trade of corn
grows beyond 64.3 million Mt to 75 million MT by 2010.
Exports of Argentina, Brazil, and S. Africa are now
projected to be 11.00 5.81, and 4.50 million MT respectively. Argentina may have an upper edge over Brazil because its cost of production and technology inputs are similar to the United States. The new and large
CORN FOR FOOD & FIBER
Description
markets are going to be Brazil, China, and India. The total utilization of starch in the world today is 48.5 million tons (USDA, EU Commission) with a corn equivalence of 78.22 million MT. The global corn utilization may grow to more than 100 million MT by year 2000 given the 2.25% growth rate in the new economies. Whereas the current growth rate in US, EU, and Japan are 0.65, 0.2%, and 0.18% respectively, the rest of the world growing at 2.25%. Both US and EU will have to compete for this growth in China, India, Indonesia, and South America. Cassava in SE and S Asia and Central America
will become more dominant starch commodity as new
Approximate yield of one metric
production technologies are employed. EU is already
ton no. 2 yellow dent corn with
ahead of US both in cassava and wheat starch production.
15.5% moisture
Cassava, we need to recognize, is only 7.5 % of world
625 kg starch 88% dry matter
starch. In any economic analysis, we have to view starch
714 kg corn syrup 80% dry matter
668 kg dextrose 91.5% dry matter
as a competing raw material of cereal grains in food
845 kg 42 HFCS 71% dry matter
formulation (sweeteners and sugar, hydrol and molasses,
778 kg 55 HFCS 77% dry matter
and resistant starch and dietary fiber). Chemical feed
600 kg HFCS 100% dry matter
stocks, amino acids, organic acids, and ethanol production
250 kg 21% gluten feed, 89% dry matter
50 kg 60% gluten meal, 89% dry matter
from starch no doubt add extra dimensions to the overall
27 kg corn oil, 100% dry matter
Global Production and Utilization of Starches
REGIONAL DIFFERENCES
Maize Potato Wheat Other Total
USA 24.6 0.00 0.30 0.0 24.9EU 3.90 1.80 2.80 0.0 8.4
EU is a net starch raw material importer with 15 plants that
Others 10.90 0.80 1.10 2.50 15.20
van process corn, wheat, and potato. EU will have rough
World 39.40 2.60 4.10 2.50 48.50
time removing subsidies against exportable starch
Source: LMC International
products. Its CAP policy restricts Cassava. French
Note: EU uses 4 mil MT for sweetener, 1.9 mil Mt for modified starches, and 2.5 mil MT starch formative starches.
Cassava from Costa Rica is on the Rise. Wheat starch
increased through out nineties and potato has remained
constant at a fixed quota of 1.864 mil tons. The most
Global Starch & Starch Products ( mil MT)
important point to note is that US and EU are moving in
Global Corn use 77.00 mil MT; Tapioca-7.9 mil
opposite directions in their starch utilization policies.
MT; Potato-2 mil MT; Wheat- 1.25 mil MT
No doubt, Eastern Europe gives EU the advantage of
better growth. This prospect notwithstanding, there are
two many operators including Agrana, Grants, ABR, Syral,
3.32 Pfeifer Langen, Cerestar, Amylum, Avebe, Cargill,
Emsland, and Roquette and consolidation in near future is
4.10 a given. There does exist over capacity except for 2002
($3.00 billion Value)
when capacity utilization was around 91%. EU is different
4.50 from US on the following lines.
corn Dry Milling +
"Very little allocation to Gasohol, Substantial Production of wheat
starch, Very highly developed paper industry, Extensive Use of
both potato and tapioca starch internally, Most wheat is for export
(extra EU export), Heavily subsidized production, and Well
developed and cost effective chemical modification processes".
CORN FOR FOOD & FIBER
Description
US SHIPMENTS: 1998
Refined Corn Starch
MT (as is)
US is largely corn/Maize processor. Wheat is a miniscule
Products
0.3 million ton per year. Close to 40.5% starch goes for
Starch Products (corn
Ethanol in the US compared to only 1.19% in entire
starch, modified starch and dextrin)
Europe. US position on Ethanol represents a problem in
HFCS; High fructose corn
the schemes of value addition because of subsidization.
Also, US is not a significant exporter to South America
HFCS: High fructose corn
today and wholesale entry may not be possible because of
syrup 55% Other Refinery Products
wheat starch from Canada.
(glucose syrup, dextrose,
corn syrup solids,
US companies are going to be forced to go after capital
and operational efficiency by process cost controls
Total Starch and Starch
specially when raw material cost advantage is not going to
Source: Corn Refiners Association
be there. Partnerships for market access are limited and
acquisition has already taken its more or less full course.
US IMPORTS-1997
When Capital costs equal depreciation and sales decline
US Imports, 1997
or remain constant, R&D inputs and new technology
deployment is a business necessity. Biotechnology, just
as during the two decades, is the only bright light.
Advances in oxy-chemical production for synthetic
polymers and fermentation chemicals for food and feed
Dextrins, derived from
are viewed as new schemes for value addition. Dupont,
Modified Starches
BASF. Celanese along with their biotechnology partners
derived from Potato
(Genencore, Diversa, Metabolix) will be very instrumental
in reshaping the corn processing industry in the US.
Modified Starches,
Nesoi Source: Stat-USA.
Already criticized by European Commissioner, Franz
Fischler a $190.00 billion subsidy in the US over the next 10 years will remain to be a contentious issue in global trade. In comparison respective EU and Japanese susidies are at $60.00 and 30.00 billion per year. Actually all OECD governments protect their subsidy policies and programs ("Agricultural Policies in OECD Countries: Monitoring and Evaluation 2002, June 6, 2001"). In 1995, total OECD transfers in this regard were US $335.00 billion ($16,000 per farmer). GLOBAL PRODUCTION, PRICING AND TRADE Financing of development (FAO, World Bank, International Monetary Fund) all get tied to subsidies and trade in the long range. Development assistance in the world today is
$50 billion business. In contrast, export earnings of
developing countries are $1.8 trillion. If you could get
exports from developing countries to double in ten years, you are talking about a figure over $3.5 trillion. It is important to recognize that if you are asking the question "how much is it going to cost?", you have to look at all the sources of income and include export earnings, the domestic savings of the developing countries, the
CORN FOR FOOD & FIBER
Description
contribution that foreign direct investment can make, as well as foreign assistance (US Secretary of Agriculture, Veneman, 2002) Will the Farm Bill keep US within WTO limits in view of $20.00 billion subsidy in US compared to 60.00 billion of EU. Per WTO agreements, the major trading countries have made commitments to keep their subsidy programs within certain caps. Producer subsidy equivalents tell us something: In 2001, US was 21%, EU was 35%, and Japan had it at 59%. As long as the productivity is high the subsidies will survive and there is not much wrong with it as long as they are competitive.
Development finance and schemes of productivity gains
via technology inputs lag In the developing countries. EU Starch as such is not subsidized but the raw materials such as wheat and maize are. Potatoes are an awkward product, not fitting into the EU system for the simple reason that potatoes can not be stored making it impossible for the Commission to purchase and put them in store, if other means to control the market mechanisms fail. On the other hand - potatoes are a fundamental European crop for starch and it is critical from the EU point of view to keep the potato starch competitive with import dependent maize starch.
UNCERTAIN PRODUCTIVITY AND PROFITABILITY
1. Variety Preference
Wet Milling- Yellow Dent
Current Global Chemicals
Dry Milling and Masa production- White Dent
Production from Starch for Food,
Africa and Argentina- Flint types
Feed, Fiber and Industrial (1998),
Canadian corn – semi-dent
Million MT
Specialty Chemical
2. Variable Production
Potential Biodegradables
Canadian production can range from 7 to 9 million MT.
US production can from 220 to 255 mil MT.
US demand is around 195 Mil MT including 30 million MT for
ethanol. This fluctuates widely.
Furfural, Corn Cob
US Export can range between 50 to 55 million MT.
Isosorbide ….
Chinese production has ranged between 105 to 128 mil MT.
Lactic Acid, Current Cap
China exports in a range of 7 to 9 mill MT to neighboring
Mono Sodium Glutamate
China can maintain a carry over of up to 30-60 mil MT.
1,3 Propanediol,
Global Trade ranges between 64 to 72 million MT.
Sorbitol, Manitol
Eighty three percent of all global starch comes from corn.
The US produces 5% of all global starch mostly from corn.
Mexico may soon surpass Japan in starch production capacity.
CORN FOR FOOD & FIBER
Description
Other possibilities are production of
polyhydroxybutyrate/valerate, succinic acid,
EU 1992: 20% of the starch was used in its native form,
butanediol, polypropylene glycol, polyethylene glycol, glycerol, levulinic acid, itaconic acid,
16% as modified starch and 64% as HFCS, glucose
other amino acids, and organic acids.
syrups and crystalline dextrose. Japan, South Africa, and
Australia have a similar pattern. In other parts of Asia and
Africa native starch constitutes a much larger proportion of
Source: T.P. Shukla, F.R.I. Enterprises, LLC
the total outlet for starch. In many low GNP countries
starch sweeteners are practically absent and whole corn is
used as staple food
Triveni P. Shukla, Ph.D.
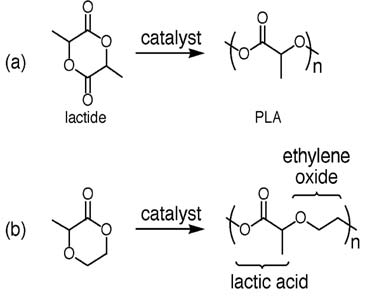
Polylactide- a cyclic ester
Cargill/DowAgro
World Corn Production and
Consumption
Production
2000/2001 2001/2002
Philippines 4,508
Union Others 54,720
Consumption
2000/2001
2001/2002
J. Chem. Soc., Dalton Trans. 2001, 2215-2224
ISOSORBIDE, ROQUETTE
Macromolecules 2001, 34, 8641
CORN FOR FOOD & FIBER
Description
604,276 620,146
Du Pont's Sonora
Corn in India
India – 10th in the World
(Average Yield is 0.7 MT compared to 3 tons/acre in the US.) Corn
Phytosterol and Polyols
Gluten Feed 3% Oil + 57% Sugar + 40% Protein
Phytosterol
Propylene Glycol
Ethylene Glycol
Nutraceutical
Phytosterol
National Corn Growers/ADM/ Pacific Northwest National Lab
Pradesh Other 346
10,612 1.7
CORN FOR FOOD & FIBER
Source: http://www.primaryinfo.biz/updates/export-Opportunities/Markets/GlobalCornProcessing.pdf
Untitled
Blackwell Publishing Asia Evaluation of radioiodinated vesamicol analogs for sigma receptor imaging in tumor and radionuclide receptor therapy Kazuma Ogawa,1,2,5 Kazuhiro Shiba,2 Nasima Akhter,3 Mitsuyoshi Yoshimoto,3 Kohshin Washiyama,3 Seigo Kinuya,3 Keiichi Kawai3,4 and Hirofumi Mori2 1Graduate School of Natural Science and Technology, 2Advanced Science Research Center, 3Graduate School of Medical Sciences, Kanazawa University, Kanazawa; 4Biomedical Imaging Research Center, University of Fukui, Fukui, Japan
files.appcnc.org
Teen Pregnancy Prevention In North Carolina. NC's teen pregnancy rate has dropped 67% since 1991, declining faster than the national teen pregnancy rate.1 NC has the 20th highest pregnancy rate in the US, according to the most recent nationwide comparison. 2 Significant disparities exist based on age and race/ethnicity. Seventy-three percent of teen pregnancies happen to a teen who is 18 or 19 years old. Preg-nancy rates for African-American and Hispanic teens are 40% higher and 64% higher than those for white teens, respectively. 1