Doi:10.1016/j.jcis.2007.09.008
Journal of Colloid and Interface Science 316 (2007) 762–770 Structure and size of spontaneously formed aggregates in Aerosol OT/PEG mixtures: Effects of polymer size and composition M. Mercedes Velázquez Margarita Valero Francisco Ortega J. Benito Rodríguez González a Departamento de Química Física, Universidad de Salamanca, E-37008 Salamanca, Spain b Departamento de Química Física I., Facultad de Ciencias Químicas, Universidad Complutense de Madrid, E-28040 Madrid, Spain c Microscopía Electrónica de Alta Resolución y Caracterización de Materiales, C.A.C.T.I., Universidade de Vigo, E-36310 Vigo, Spain Received 3 May 2007; accepted 3 September 2007 Available online 7 September 2007 Dynamic light scattering and Cryo-TEM measurements have allowed us to obtain the size and structure of spontaneous aggregates formed by mixtures of Aerosol OT, AOT, and ethylene glycol polymers of different molecular mass. The results presented in this work show that small unil-amellar vesicles predominate in pure Aerosol OT solutions and in dilute polymer solutions mixed with AOT. In the latter case, elongated micellescoexist with unilamellar vesicles. When polymer concentration increases above a certain concentration, the small vesicles disappear and the sizeof the elongated micelles decreases to a radius compatible with spherical micelles. For PEG concentrations above the overlapping ones, sphericalmicelles coexist with very large aggregates probably formed by large rod like micelles or by superstructures of elongated micelles embeddedin a polymer network. This behavior is consistent with theoretical models based in molecular mean-field theory [M. Rovira-Bru, D.H. Thomp-son, I. Szleifer, Biophys. J. 83 (2002) 2419]. The properties of the different types of aggregates are obtained by fluorescence spectroscopy andelectrophoretic mobility measurements.2007 Elsevier Inc. All rights reserved.
Keywords: Aerosol OT; Spontaneous vesicles; Poly(ethylene glycol); Nabumetone; Fluorescence probing; Electrophoretic mobility; Light scattering measurements; Cryo-TEM sources have been described. These procedures involve surfac-tant mixtures, catanionic cationic/cationic nonionic/ Vesicles and biomembranes consist of a surfactant bilayer ionic These spontaneous vesicles are thermodynamically that separates an inner region of water from a continuous phase stable in contrast to the ones formed by nonequilibrium meth- of the same fluid. They play critical roles in compartmental- ods. The challenge in formulation is to find inexpensive stable ization functions as varied as nutrient transport and DNA pro- vesicles with well-defined sizes. Spontaneous vesicle formation tection Phospholipids are the natural components of cell in mixed aggregates seems to be caused by curvature-induced membranes whereas synthetic surfactants form vesicles widely asymmetry in the composition of monolayers To determine used in cosmetic products, in microencapsulation for drug de- the optimal characteristics of a vesicle, complex theoretical ap- livery, or as anticancer agents The majority of processing proaches have been developed These models showed methods for vesicles or liposome production use an input of that a small variation in composition is enough to result in large energy, ultrasonic treatment, elevated temperature or pressures change in the optimal size and in the existence of spontaneous to disperse surfactants as a vesicle phase that in most cases is unstable and highly polydisperse. However, a limited num- On the other hand, it was demonstrated that the inclusion of ber of alternative procedures that do not use external energy small percentage of polymers in liposome formulations usedas drug carriers increased their circulation time in vivo, fa- * Corresponding author. Fax: +34 923 294574.
voring the uptake in the target site Their resistance to E-mail address: (M.M. Velázquez).
blood stream is due to steric stabilization by the polymer layer 0021-9797/$ – see front matter 2007 Elsevier Inc. All rights reserved.
M.M. Velázquez et al. / Journal of Colloid and Interface Science 316 (2007) 762–770 anchored on the surfactant layer One of the most com- tain <0.5% (w/w) of 2-ethyl hexanol. This alcohol is formed by mon polymers used for this purpose is poly(ethylene glycol) hydrolysis of either one or both of the two hydrocarbon tails.
because it is not toxic. However, PEG-lipid liposomes tend Poly(ethylene glycol) fractions PEG 6k, PEG 17k, and PEG to form micelles when polymer concentration exceeds a cer- 35k were used as received and the molecular weight provided tain concentration. This concentration decreases as the polymer by the manufactured (Fluka) were 6, 17 and, 35 kDa, respec- molecular weight increases However, while there is a sub- tively. Nabumetone, 4-[6-methoxy-2-naphthyl]- 2-butanone stantial body of information about the effect of polymers on the was from Sigma Chemical Co. and was used as received with- properties and stability of liposomes obtained by an input of en- out further purification.
ergy less attention is directed toward the effect of polymers in The pure vesicles were prepared by adding the calcu- spontaneously formed vesicles. Therefore, our present goal is to lated amount of surfactant to the solvent, water. In polymer– investigate the effect of adsorbed PEG polymers on Aerosol OT surfactant mixtures, the surfactant was dissolved in the aqueous vesicles. We choose Aerosol OT because it forms spontaneous polymer solution with a given concentration. The most dilute vesicles in water in some surfactant concentrations. In ad- solutions were prepared by dilution from the stock concentrated dition, its phase diagram in water and in saline solutions has solution. In all cases, care is taken not to use external energy in- been studied by means X-ray and SANS experiments put except a gentle stirring.
In the dilute part of the diagram the micellar phase predomi- The solutions were prepared with water purified with a com- nates at AOT mass fractions below 1.4%, while between 1.4 and bination of RiOs and Milli-Q systems from Millipore. All so- 10% micelles are in equilibrium with vesicles; finally up to 10% lutions were prepared the day before to obtain experimental of AOT mass fractions the existence of a single lamellar do- measurements and were maintained at 30 ◦C. At this temper- main is not clear From these results one can conclude that ature, all solutions are clear.
even though the phase diagram of aqueous AOT has been pre-sented, the surfactant dilute region need to be clarify by obtain- 2.2. Steady-state fluorescence measurements ing the size or the critical concentration by means of techniquesmore sensitive to concentration that SANS. Therefore, in previ- The emission spectra of nabumetone incorporated to AOT ous works we have characterized the dilute region determining vesicles were recorded with the LS-50B spectrofluorometer the critical concentration of vesicles for pure AOT and for bi- from Perkin–Elmer. The concentration of nabumetone was kept nary mixtures of AOT with poly(ethylene glycol), PEG 17 kDa, constant at a value of 4 × 10⁻⁵ M. The excitation wavelength NaCl and poly(sodium 4-styrene sulfonate), PSS Re- was 317 nm and the excitation and emission slits were 2.5/2.5 sults showed that the addition of PSS, PEG and NaCl decreases or 3/3 nm depending of the fluorescence intensity. The instru- the aggregation critical concentrations However, the effect mental response at each wavelength was corrected by meansof the curve provided with the spectrofluorometer. The fluores- induced by additives is different; in the case of PSS and NaCl, cence quantum yield, Φ, was calculated using quinine sulfate there is a screening of the surface charge while the adsorption of in 0.1 N sulphuric acid as reference (Φ PEG molecules at the interface seems to be responsible for the ref = 0.543). The spectra were recorded at 30.0 ◦C.
decrease of the aggregation concentration In these works,the polymer concentration was always in the dilute regime.
2.3. Zeta potential measurements However, we are interested to investigate systematically the ef-fects of both, polymer concentration and mass on the stability The Zetasizer 3000 device (Malvern, UK) was used to carry of vesicles. Therefore, we have expanded the PEG concentra- out the electrophoretic mobility of vesicles. This apparatus uses tion at the semidilute regime and the polymer mass from 6 kDa laser-Doppler velocimetry to measure the electrophoretic mo- (PEG 6k) to 35 kDa, PEG 35k. Taking into account that the bility, μ structure of the interface plays an important role on vesicle sta- e. All experiments were made in a 5 mm × 2 mm rectangular quartz capillary. Each experimental value is the av- bility we have obtained the properties of the vesicle erage of ten measurements and the standard deviation of these interfaces by means of fluorescence probing and electrokinet- measurements was considered the experimental error. The elec- ic's measurements Finally, using dynamic light scattering trophoretic mobility values were also obtained at 30.0 ◦C.
measurements and cryogenic transmission electron microscopy,Cryo-TEM we determine the size and the morphology of sur- 2.4. Light scattering measurements factant aggregates without and with polymers.
Dynamic light scattering were performed with an CGS-8 2. Materials and methods
from ALV GmbH working in pseudocross-correlation mode,using the green line (λ = 514.5 nm) of an argon ion laser 2.1. Reagents and vesicle preparation (Coherent I300). The intensity correlation functions were ob-tained at a fixed temperature of 30.0 ◦C and as a function of the The surfactant sodium bis(2-ethyl-hexyl) sulfosuccinate was scattering angle, θ , between 30 and 140 ◦C, corresponding to purchased from Fluka and was purified according to the pub- wavevectors, q, from 8.42 × 10⁴ to 3.14 × 105 cm−1 defined as lished method The purity was evaluated by using gas chromatography The results indicate that the samples con- q = 4πn sin
M.M. Velázquez et al. / Journal of Colloid and Interface Science 316 (2007) 762–770
where n is the solution refractive index.
The normalized second order correlation functions (g(2)(t))
were analyzed using both GENDIST and CONTIN inverse Laplace algorithms, giving both similar relaxation timedistributions. From the average relaxation times, τ , the appar-ent diffusion coefficients, Dapp, were obtained and using theStokes–Einstein relation, the apparent hydrodynamic radii werecalculated
1/τ = Dappq2 =
app q 2.
2.5. Cryogenic transmission electron microscopy, Cryo-TEM
Cryo-transmission electron microscopy is a particular tech-
nique for the direct visualization that has been used to obtain
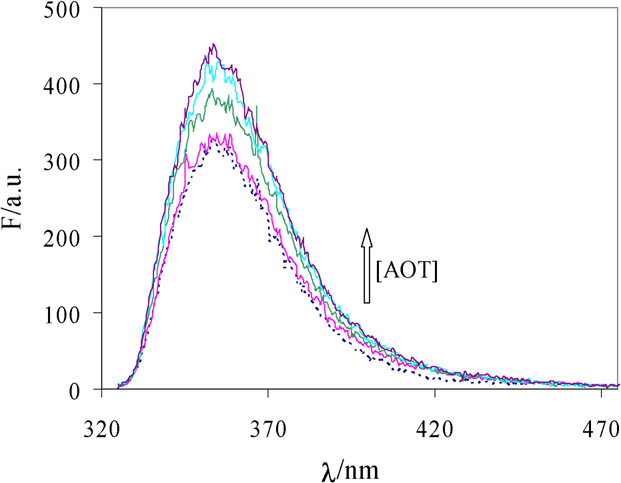
Fig. 1. Fluorescence spectra of nabumetone solubilized in vesicles of AOT with
direct high resolution images of surfactant aggregates such as
0.6% PEG 17k containing different surfactant concentration. Dotted line is the
micelles, vesicles and different structures formed in polymer–
fluorescence spectrum of nabumetone dissolved in aqueous polymer solution.
surfactant systems The sample (0.1 µl) was depositedon a carbon-coated holey polymer film in a controlled envi-ronment vitrification system, (CEVS) Gatan cryoplunge, wheretemperature and relative humidity are controlled. The excessliquid is blotted away with filter paper and quickly vitrified inliquid ethane. The sample is then transferred to a JEOL JEM2010 FEG electron microscope by means of a Gatan CT 3500Cryo-transfer system. The observations were made to an ac-celeration voltage of 200 kV. The working temperature was−170 ◦C and the images were recorded on a digital cameraGatan MSC794. The pictures were taken at a certain defocusto obtain high-quality images.
3. Results and discussion
3.1. Steady-state fluorescence measurements
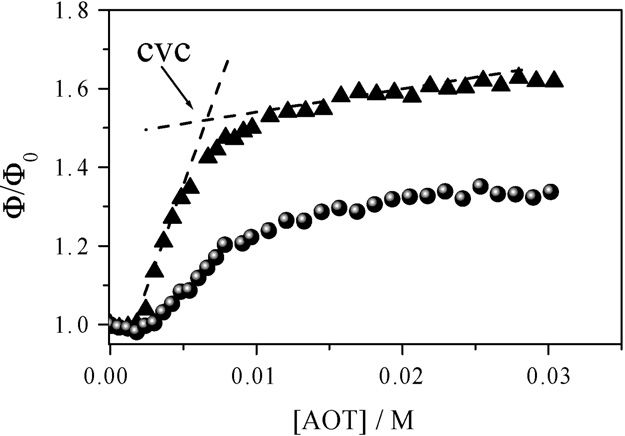
Fig. 2. Effect of the AOT concentration on the fluorescence quantum yield ofnabumetone solubilized on AOT/PEG 6k aggregates: triangles [PEG 6k] = 1%and circles [PEG 6k] = 10%. The quantum yield is normalized respect to that
The emission spectra of nabumetone dissolved in Aerosol
of nabumetone dissolved in polymer solutions, see text.
OT vesicles and in AOT–polyethylene glycol vesicles were ob-tained. Some of these spectra are represented in As can
cvc, see The cvc values found using this method ac-
be seen in the figure the nabumetone emission spectrum con-
ceptably agree with those obtained from conductivity or surface
sists in a broad band centered at 350 nm and the emission in-
tension measurements Differences between the cvc values
tensity increases as the surfactant concentration also increases.
obtained with distinct techniques were analyzed elsewhere
To quantify differences between emission intensity, the fluores-
and shown that the quantum yield of nabumetone can be used
cence quantum yields, Φf, is preferred to fluorescence intensity;
to estimate the cvc of vesicles As can be seen in the fig-
then the variation of Φf with surfactant concentration is repre-
ure, the nabumetone quantum yield increases more sharply in
sented in Results represented in the figure correspond
aggregates dissolved in dilute polymer solutions.
to mixed vesicles of AOT and PEG 6k, similar behavior is
The photochemical behavior of this probe has been stud-
observed in all mixtures studied. For the sake of clarity, the
ied and the results indicated that nabumetone exists in
fluorescence quantum yield of nabumetone dissolved in mixed
two conformations, the folded conformation, low Φf, respon-
polymer–surfactant aggregates was normalized respect to the
sible for the fluorescence quenching of the naphthalene ring
quantum yield of nabumetone dissolved in aqueous polymer so-
by the butanone side chain, and the extended conformation
lution (Φ0) with polymer concentration match those in the AOT
with high Φf. The folded conformation predominates in aque-
ous solutions (≈91%). According to values found, in the
Results presented in show that the quantum yield of
most dilute surfactant solutions the folded conformation pre-
nabumetone increases with AOT concentration until it reaches
dominates, while at high surfactant concentrations, the probe
a plateau at a particular surfactant concentration, cvc, corre-
is transferred to a more hydrophobic microenvironment, and
sponding to the vesicle formation. The cvc is obtained from
the quantum yield increases. Finally, when the AOT concen-
the interception of quantum yield values above and below the
tration reaches the cvc the probe nabumetone is incorporated
M.M. Velázquez et al. / Journal of Colloid and Interface Science 316 (2007) 762–770
Table 1Critical vesicle concentration values found for Aerosol OT vesicles
hope that the anchored polymer molecules destabilize the vesi-cle and lead to the formation of different kind of aggregates.
From fluorescence results, the polymer concentrations cor-
responding to vesicle–micelle transition do not present amonotonic behavior with the polymer molecular weight. Thus,the vesicle–micelle transition seems to be favored by the addi-tion of PEG molecules of intermediate weight, PEG 17k. Thisfact can be due to the preferential adsorption of this polymerat the vesicle surface. The polymer coverage of the vesicle sur-face may be controlled by varying polymer concentration orvarying polymer size. The anchoring free energy of a poly-mer molecule consists in two main components the energygained by inserting the polymer into the surfactant monolayerand the entropy lost by constraining the chain by the surface.
Fig. 3. Effect of polymer concentration on the fluorescence quantum yield of
These components have an opposite dependence on the poly-
nabumetone solubilized in AOT/PEG aggregates: (triangles) PEG 6k, (squares)
mer mass; consequently, the polymer adsorption goes through
PEG 17k and (circles) PEG 35k. The AOT concentration is 0.03 M. The linesare guide to the eyes.
a maximum at a certain polymer size
We also analyze the effect of the polymer molecular weight
to the aggregates and the quantum yield remains constant. In
on the quantum yield of nabumetone. As can be seen in
a previous work, nabumetone was successfully used to
the lowest quantum yield values correspond to mixtures withPEG 17k, while no very significant differences are observed
determine the critical concentration of pure vesicles of AOT
on the quantum yield values of aggregates with PEG 6k and
and mixed vesicles formed by AOT and a water-soluble poly-
PEG 35k. This fact can be explained if one takes into account
mer, PSS or PEG 17k. In the work, the polymer solutions are
that nabumetone is strongly quenched by water and that
always in dilute regime. The cvc is evaluated from the nabume-
nabumetone is located at the vesicle interface Thus, the
tone quantum yield vs surfactant concentration curves and the
low the quantum yield values in systems with PEG 17k can be
values are collected in Taking into account that the
due to an increase of the hydration of the surfactant head group
cvc of pure AOT vesicles is 7.3 mM the cvc values
at the interface. Baran et al. showed that different hydration
show two different trends, for dilute polymer solutions the cvc
levels can be induced by the adsorption of PEG and correspond
decreases as compared with pure AOT vesicles. This classical
with two PEG structural configurations: the PEG molecules ad-
behavior in polymer–surfactant mixtures indicates the existence
sorbed in form of random coil, low hydration level, and the
of polymer–surfactant interactions responsible of the stabiliza-
strongly adsorbed polymer molecules giving a brush structure,
tion of the aggregates This fact is consistent with results
highly hydrated surface. Thus in our systems, the fluorescence
obtained elsewhere for AOT/PEG 17k in dilute polymer solu-
results seem to indicate that PEG 17k induces higher hydration
tions Conversely, when polymer concentration increases
on the vesicle surface than PEG 6k or PEG 35k. This fact is
up to a certain value the cvc is higher than that for pure AOT
probably due to the stronger adsorption of this polymer at the
vesicles. In addition, the nabumetone quantum yield increases
more sharply in aggregates dissolved in dilute polymer solu-
All these results clearly show that the properties of vesicle
tions. These facts seem to indicate the existence of two different
interface plays and important role on the stability of aggregates.
This is consistent with theoretical predictions and experi-
presents the variation of nabumetone quantum yield
mental observations To obtain more information about theinterface of the different aggregates the electrophoretic mobil-
with polymer concentration. The AOT concentration is kept
ity was obtained.
constant at 0.03 M. In the figure, we represent the ratio be-tween the fluorescence quantum yield of nabumetone dissolved
3.2. Electrophoretic mobility results
in AOT/PEG mixtures and dissolved in pure vesicles of AOT,referred as Φvesicle. The quantum yield of nabumetone increases
The effect of the addition of PEG polymers on the elec-
as the polymer concentration increases and it reaches a constant
trophoretic mobility of AOT vesicles was investigated and the
value at a certain polymer concentration: 2.7% for PEG 6k,
results are presented in The electrophoretic mobility
1.5% for PEG 17k and 2.5% for PEG 35k. All these facts seem
curves decreases as the polymer concentration increases and
to indicate the existence of different aggregation processes de-
the effect is more pronounced in PEG 17k. The diminution of
pending on polymer concentration. In particular, one could
the electrophoretic mobility by the addition of polymers was
M.M. Velázquez et al. / Journal of Colloid and Interface Science 316 (2007) 762–770
The inverse decay time shows the expected q2 depen-dence in the case of the polymer, while for AOT shows a nonq2 only above a scattering angle of 100 ◦C.
In the case of vesicles the non q2 behavior has been pre-
dicted when Helfrich interfacial elasticity is properly consid-ered in the calculation of the scattering function a moredetailed study on this matter will be presented in a future paper.
All the experiments corresponding to mixtures present mul-
tiexponential correlation functions and the ILT treatment givescomplex distribution functions. presents the distribution
function, on the apparent hydrodynamic radius scale (R
two different concentrations of PEG 6k and illustrates the be-havior found for the rest of polymer molecular weights.
Fig. 4. Effect of the mixture composition on the electrophoretic mobility of
At low polymer concentrations the distribution functions
vesicles composed of 0.03 M of AOT and variable polymer concentrations:
show two components, the one corresponding to the highest ra-
PEG 6k (triangles), PEG 17k (circles) and PEG 35k (squares). The arrows point
dius, shows similar q2 inverse decay time dependence to the
the polymer concentration at which the fluorescence quantum yield reaches a
pure AOT vesicles, with a apparent hydrodynamic radius of
constant value.
(57.7 ± 0.6 nm). The second component corresponds to thelowest radius and has the expected q2 dependence for all the
previously observed for AOT/PEG 17k in dilute polymer con-
scattering angles. The average radius (6.6 ± 0.4 nm) found for
centrations, and was interpreted using the diffuse double layer
this component is compatible with an elongated micellar ag-
theory According to it, the PEG adsorption on the inter-
gregate. collects the rest of the R
values along with
face gives a relatively thick layer on the surface, which shifts
the amplitudes of the different modes at the scattering angle of
the slip boundary toward the bulk solution decreasing the elec-
trophoretic mobility
At high polymer concentrations, the distribution functions
In all these systems, when the polymer concentration in-
also show two components, both have linear inverse decay time
creases, the electrophoretic mobility decreases in absolute value
q2 dependences. The average R
values found for 10% PEG
and reaches a plateau. The end of the plateau corresponds to
6k ([AOT] = 0.03 M) were 1.5 ± 0.1 nm and 299 ± 4 nm, and in
the polymer concentration at which the fluorescence quantum
are collected the rest of the values. The size of the low-
yield reaches a constant value, arrows in A further poly-
est component is compatible with spherical micelles while the
mer addition gives smaller absolute values of μe that may be an
highest size component may correspond to very large rod like
indication of the transition from vesicles to micelles.
micelles or to superstructures of elongated micelles embedded
The electrophoretic mobility measurements are consistent
in a polymer network.
with fluorescence results. Thus, the aggregates with PEG 17kpresent the smallest electrophoretic mobility in absolute value.
3.4. Cryo-transmission electron microscopy, Cryo-TEM
This fact indicates that PEG 17k forms the densest polymerlayer responsible of both the lowest quantum yield values of
To reveal the structures formed at different AOT–polymer
nabumetone and the lowest electrophoretic mobility in absolute
compositions and to help elucidate the light scattering results,
the systems were analyzed by means of Cryo-TEM. This tech-nique allows direct examination of microstructures after rapid
3.3. Light-scattering measurements
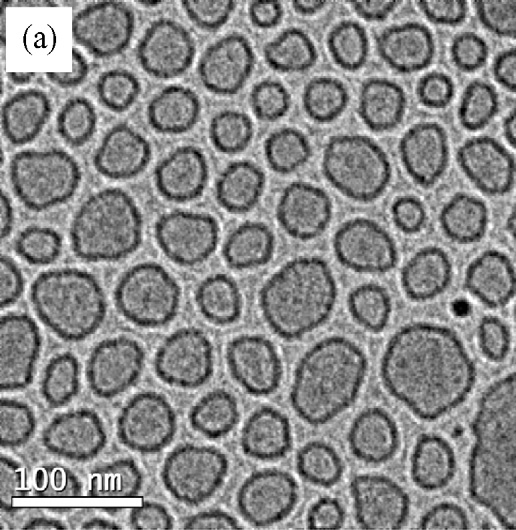
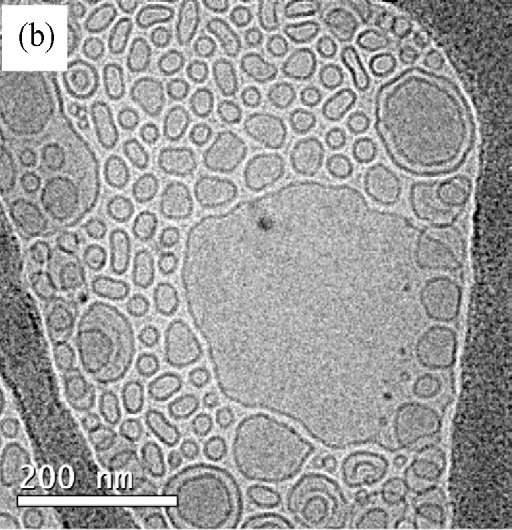
freezing of the hydrated specimens. Cryo-TEM pictures ob-tained from an aqueous solution of Aerosol OT 0.01 M are
In order to obtain information on the effect of polymer ad-
in We have obtained a large number of pictures from
dition on aggregates size, dynamic light-scattering experiments
aqueous solutions of 0.01 and 0.03 M of AOT; pictures showed
have been performed at 30.0 ◦C with different polymer concen-
in were chose for the high quality of images and be-
trations, and keeping constant the AOT (0.03 M). For compar-
cause are the most representative of the size distribution of AOT
ative purposes, the size of pure components, AOT aggregates
vesicles. The figure shows that monodisperse small unilamel-
and aqueous polymers were determined. In the former the AOT
lar vesicles, SUV, with a radius of about 20 nm predominate
concentration is also 0.03 M and in the latter, the polymer
in this system. also shows the existence of multilamel-
concentrations were the highest used in mixed systems, which
lar vesicles, MLV, in a small proportion as compared with AOT
in all cases is well above the overlapping concentration
vesicles. The biggest aggregates were observed by optical mi-
(c∗(PEG 35k) = 0.9% w/w, c∗(PEG 17k) = 1.4% w/w, c∗(PEG
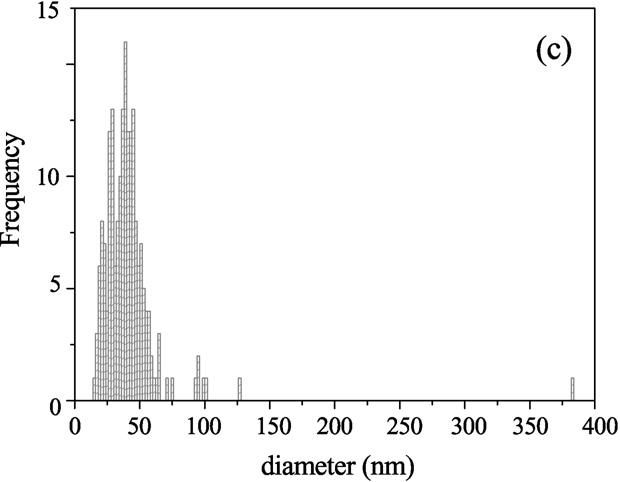
croscopy shows the distribution of the outer vesicle
6k) = 3% w/w).
diameter for 200 vesicles taken for Cryo-TEM. Results show
Both pure AOT and PEG solutions give single exponential
an almost monomodal distribution of vesicles. Qualitatively,
correlation functions that, when analyzed using reg-
the light scattering results agree with Cryo-TEM ones show-
ularized inverse Laplace transforms (ILT) (GENDIST, CON-
ing that Aerosol OT solutions consists in rich monodisperse
TIN), lead to single peak decay time distributions
vesicles system. However, the radius measured by light scat-
M.M. Velázquez et al. / Journal of Colloid and Interface Science 316 (2007) 762–770
Fig. 5. (A) Normalized second order correlation functions, g(2)(t), and (B) the inverse decay time values vs the square wavevectors for pure AOT 0.03 M and forpure PEG 35k (5% w/w).
tering (RH = 68.5 nm, for AOT 0.01 M), is significantly larger
In dilute polymer solutions, below the overlapping one,
than the radius measured by Cryo-TEM (diameter = 40 nm).
Cryo-TEM shows no clear images, probably due to vesicle as-
This can be partly because scattering yields an intensity aver-
sociation in the freezing process and the formation of too big as-
age while Cryo-TEM gives a number average and so the former
semblies Thus, we use Cryo-etch SEM to confirm this fact.
weights larger aggregates that scatter more light and shifts the
The procedure of preparation of samples and some of these im-
hydrodynamic radius toward larger values
ages are in Supplementary material section. The pictures show
Cryo-TEM images for AOT solutions with polymer con-
big colloidal assemblies probably due to vesicle association in
centrations above the overlapping one show that the system
the freezing process. The formation of aggregates of similar
is formed by spherical micelles with a micelle radius be-
structure was observed in saline surfactant solutions or in
tween 2.5 and 3 nm in agreement with light scattering results.
binary colloidal systems The structure of these assemblies
In addition, some large aggregates of different size were ob-
is independent of the freezing procedure and preserves some
vesicles inside the colloidal aggregates.
M.M. Velázquez et al. / Journal of Colloid and Interface Science 316 (2007) 762–770
Fig. 6. Distribution functions on an apparent hydrodynamic radius scale forAOT 0.03 M and two different concentrations of PEG 6k.
Table 2Apparent hydrodynamic radius and amplitude values found using dynamic lightscattering for aggregates formed in Aerosol OT and PEG polymers in aqueoussolutions
67.3 ± 0.4
57.7 ± 0.06
6.6 ± 0.4
1.5 ± 0.1
60.5 ± 0.06
2.4 ± 0.05
1.7 ± 0.02
3.4 ± 0.1
2.4 ± 0.2
Note. Amplitudes of the different modes, Ai , correspond to 90◦ while the RHvalues are obtained from the inverse decay rate vs square wave vector plots.
Cryo-TEM and light scattering results indicate that monodis-
perse small unilamellar vesicles (SUV) form pure AOT solu-tions. The addition of small concentrations of PEG 6k, PEG 17k
Fig. 7. Cryo-TEM micrographs from an aqueous solution of Aerosol OT 0.01 M
and PEG 35k leads to the appearance of elongated micelles
sample; (a) monodisperse small vesicles area; (b) multilamellar and small vesi-
coexisting with SUV's. With a further increase in PEG con-
cles area; (c) histogram of vesicle sizes from Cryo-TEM images.
tent, SUV disappears and the size of the elongated micellesdecreases to a radius compatible with spherical micelles. Forthe highest PEG concentrations all the polymers are well above
or to superstructures of elongated micelles embedded in a poly-
the overlapping concentration, in these cases coexisting with
mer network. According to the results found in this work, the
spherical micelles, very large aggregates have been detected.
addition of PEG on AOT water solutions induces the following
These aggregates may correspond to very large rod like micelles
M.M. Velázquez et al. / Journal of Colloid and Interface Science 316 (2007) 762–770
SUV −→ SUV + elongated micelles
assemblies formed in the freezing process in solutions with
[dilute polymer regime]
Aerosol OT and PEG 6k. The surfactant concentration remains
constant at 0.03 M AOT while that PEG 6k concentrations were
−→ Spherical micelles + large aggregates
0.03 and 1%, respectively.
[semidilute polymer regime].
Fluorescence and electrophoretic measurements seem to in-
dicate that these transitions are due to the polymer adsorption
at the vesicle interfaces. The polymer adsorption increases thearea of the surfactant at the interface, consequently, the vesicles
[1] A. Ben-Shaul, in: R. Lipowsky, E. Sackmann (Eds.), Structure and Dy-
→ micelles transition can be interpreted in terms of the packing
namics of Membranes: From Cells to Vesicles, Elsevier, Amsterdam,1995, p. 359.
parameter, P = vc/alc. In this equation, vc and lc represent the
[2] B. Ceh, M. Winterhalter, P.M. Frederick, J.J. Vallner, D.D. Lasic, Adv.
volume and the length of the surfactant hydrocarbon chain, re-
Drug Delivery 24 (1997) 165.
spectively and a is the area of the surfactant at the interface.
[3] D.F. Evans, H. Wennerström, The Colloidal Domain, second ed., Wiley–
When both mass and polymer concentration increase, P de-
VCH, New York, 1999, p. 308.
creases because the area of surfactant increases with polymer
[4] C. Tondre, C. Caillet, Adv. Colloid Interface Sci. 93 (2001) 115.
adsorption and going from AOT vesicles, P = 0.63 (1 > P >
[5] (a) E. Marques, A. Khan, M.G. Miguel, B. Lindman, J. Phys. Chem. B 102
1/2), rod-like micelles (P > 1/3) and finally spherical micelles
(b) E. Marques, A. Khan, M.G. Miguel, B. Lindman, J. Phys. Chem. B 103
for (P < 1/3).
(1999) 8353.
[6] M. Villeneuve, S. Kaneshina, M. Aratono, J. Colloid Interface Sci. 262
[7] M.I. Viseu, M.M. Velázquez, C.S. Campos, I. García-Mateos, S.M.B.
We were interested to analyze the effect of the polymer size
Costa, Langmuir 16 (2000) 4882.
[8] P. De Moor, T. Beclen, B. Komancheck, O. Díaz, R. van Santen, J. Phys.
and concentration on the vesicle stability and size in order to
Chem. B 101 (1997) 11077.
clarify the mechanism of formation of stable vesicles of a well-
[9] S.A. Safran, P. Pincus, D. Andelman, Science 248 (1990) 354.
defined size with possible applications in formulations. In pre-
[10] G. Porte, C. Ligoure, J. Chem. Phys. 102 (1995) 4290.
vious works, the authors studied the effect of polymer addition
[11] I. Szleifer, M. Carignano, Adv. Chem. Phys. 94 (1996) 165.
on the vesicles produced using an input of energy; however, we
[12] M. Rovira-Bru, D.H. Thompson, I. Szleifer, Biophys. J. 83 (2002)
think that the input of energy could affect the vesicle stabil-
[13] G. Blume, G. Cevc, Biochim. Biophys. Acta 1029 (1990) 91.
ity and therefore we chose the surfactant AOT because it forms
[14] V.P. Torchilin, V.G. Omelyanenko, M.I. Papisov, A.A. Bogdanov Jr., V.S.
spontaneous vesicles. We have demonstrated that the addition
Trubetskoy, J.N. Herron, C.A. Gentry, Biochim. Biophys. Acta 1195
of PEG polymers induces vesicles → micelles transition and
that this transition takes place via intermediate structures such
[15] G. Montesano, R. Bartucci, S. Belsito, D. Marsh, L. Sportelli, Biophys.
as elongated micelles of different sizes. The results also indicate
J. 80 (2001) 1372.
that the driving force for the vesicle–micelle transformation
[16] K. Fontell, J. Colloid Interface Sci. 44 (1973) 156.
[17] F.M. Ficheux, A.M. Bellocq, F. Nallet, Colloids Surf. A 123–124 (1997)
seems to be the formation of a PEG layer adsorbed at the inter-
face; consequently, PEG molecules with the highest adsorption
[18] M. Skouri, J. Marignan, R. May, Colloid Polym. Sci. 269 (1991) 929.
ability favor the vesicle transformation. We also demonstrate
[19] B. Balinov, U. Olsson, O. Sodermann, J. Phys. Chem. 95 (1991) 5931.
that the polymer molecular weight and the polymer concentra-
[20] I. Grillo, E.I. Katts, A.R. Muratov, Langmuir 19 (2003) 4573.
tion modify the size and distribution of the AOT aggregates.
[21] J.I. Briz, M.M. Velázquez, J. Colloid Interface Sci. 247 (2002) 437.
[22] M. Valero, M.M. Velázquez, J. Colloid Interface Sci. 278 (2004) 465.
[23] S.A. Walker, J.A. Zasadzinski, Langmuir 13 (1997) 5076.
[24] F.M. Menger, K. Yamada, J. Am. Chem. Soc. 101 (1979) 6731.
[25] S.S. Datwani, K.J. Stebe, Langmuir 17 (2001) 4287.
The work was financially supported by Ministerio de Cien-
[26] M.M. Velázquez, M. Valero, L.J. Rodríguez, S.M.B. Costa, M.A. Santos,
cia y Tecnología (BQU 2001-1507) and Ministerio de Edu-
J. Photochem. Photobiol. B Biol. 29 (1995) 23.
cación y Ciencia (MAT 2004-04180). The authors acknowledge
[27] (GENDIST) J. Jakes, Collect. Czech. Chem. Commun. 60 (1995) 1781.
the C.A.I. of Spectroscopy of the Universidad Complutense de
[28] (a) (CONTIN) S.W. Provencher, Comput. Phys. Commun. 27 (1982) 213;
Madrid for making available the light scattering facility and the
(b) (CONTIN) S.W. Provencher, Comput. Phys. Commun. 27 (1982)229.
Microscopía Electrónica de Alta Resolución y Caracterización
[29] Handbook of Chemistry and Physics, 60th ed., CRC Press, Boca Raton,
de Materiales, C.A.C.T.I., of the Universidade de Vigo for the
Cryo-TEM and Cryo-SEM facilities. M.M. Velázquez is grate-
[30] P.K. Vinson, J.R. Bellare, H.T. Davis, W.G. Miller, L.E. Scriven, J. Colloid
ful to Universidad de Salamanca for the partial support of her
Interface Sci. 141 (1991) 74.
stay in Madrid.
[31] M. Almgren, K. Edwards, J. Gustafsson, Curr. Opin. Colloid Interface
Sci. 1 (1996) 270.
[32] M. Valero, S.M.B. Costa, M.A. Santos, J. Photochem. Photobiol. A Chem.
132 (2000) 67.
[33] E.D. Goddard, Colloids Surf. 19 (1986) 255.
The online version of this article contains additional sup-
[34] Y. Barenholz, Curr. Opin. Colloid Interface Sci. 6 (2001) 66.
plementary material: Cryo-etch SEM images of big colloidal
[35] A.A. Baran, N.M. Soboleva, L.M. Dukina, Kolloid Z. 46 (1983) 840.
M.M. Velázquez et al. / Journal of Colloid and Interface Science 316 (2007) 762–770
[36] K. Hristova, A. Kenworthy, T.J. McIntosh, Macromolecules 28 (1995)
[40] M.L. Ferrer, R. Esquembre, I. Ortega, C.R. Mateos, F. del Monte, Chem.
Mater. 18 (2006) 554.
[37] S.U. Egelhaaf, M. Müller, P. Schurtenberger, Langmuir 14 (1998) 4345.
[41] I. Szleifer, O.V. Gerasimov, D.H. Thompson, Proc. Natl. Acad. Sci. 95
[38] M. Hosek, J.X. Tang, Phys. Rev. E 69 (2004) 1.
(1998) 1032.
[39] C. Ladaviere, M. Touston, Y. Gulik-Krzywicki, C. Tribet, J. Colloid Inter-
[42] F.M. Menger, H. Zhang, K.L. Caran, V.A. Seredyuk, R.P. Apkarian, J. Am.
face Sci. 241 (2001) 178.
Chem. Soc. 124 (2002) 1140.
Source: http://lbt.usal.es/wp-content/uploads/2015/10/1-s2.0-S0021979707012751-main.pdf
Glq1201043 garden party stallholders info pack.indd
From the team behind the Gloucester Quays Victorian Market and Gloucester Quays Food Festival. Landmark events attracting record breaking visitor numbers to the Quays - in excess of 80,000 in the case of the Victorian Market. We don't like to blow our own trumpet, but we think we know a thing or two about organising successful events at this venue and our latest event will be no exception.This April, the alotment chic Gloucester Quays wil be in ful bloom - with our GARDEN PARTY, which includes live
berkinglab.userweb.mwn.de
H I S TOLOGY ANDH I S TO PAT H O L O G Y Cellular and Molecular Biology Volume 16, 2001 SOME FORTHCOMING REVIEWS N. Khalil: Post translational activation of latent A. Mo re no, J . DeFe lipe, R. Gar cia Sola, A. transforming growth factor-beta (L-TGF-ß): Clinical Navarro and S. Ramón y Cajal: Neuronal and