Groenegezondheid.nl

(This is a sample cover image for this issue. The actual cover is not yet available at this time.)
This article appeared in a journal published by Elsevier. The attached
copy is furnished to the author for internal non-commercial research
and education use, including for instruction at the authors institution
and sharing with colleagues.
Other uses, including reproduction and distribution, or selling or
licensing copies, or posting to personal, institutional or third party
websites are prohibited.
In most cases authors are permitted to post their version of the
article (e.g. in Word or Tex form) to their personal website or
institutional repository. Authors requiring further information
regarding Elsevier's archiving and manuscript policies are
encouraged to visit:

Author's personal copy
Science of the Total Environment 442 (2013) 380–388
Contents lists available at SciVerse ScienceDirect
Science of the Total Environment
Prediction of concentration levels of metformin and other high consumptionpharmaceuticals in wastewater and regional surface water based on sales data
Mathijs Oosterhuis a,⁎, Frank Sacher b, Thomas L. ter Laak ca Water Board Regge en Dinkel P.O. Box 5006, 7600 GA, Almelo, The Netherlandsb DVGW-Technologiezentrum Wasser, Karlsruher Straße 84, 76139 Karlsruhe, Germanyc KWR Watercycle Research Institute, P.O. Box 1072, 3430 BB, Nieuwegein, The Netherlands
► Regional sales relevant for monitoring and emission prediction of pharmaceuticals► Metformin concentrations are 80 μg/L and 1 μg/L in wastewater and effluent respectively.
► 82% of metformin in wastewater recovered as guanylurea in effluent.
► Significant better removal at higher temperatures for 4 of 9 pharmaceuticals► Significant better removal at higher HRTs for 3 of 9 pharmaceuticals
Local consumption data of pharmaceuticals were used to study the emission to wastewater and surface waters in
Received 6 June 2012
two small Dutch water catchments. For nine high consumption pharmaceuticals: metformin, metoprolol, sotalol,
Received in revised form 28 September 2012
losartan, valsartan, irbesartan, hydrochlorothiazide, diclofenac and carbamazepine, predicted emissions were
Accepted 11 October 2012
compared to wastewater concentrations, removal in sewage treatment plants and recovery in regional surface
Available online xxxx
water. The study shows that local consumption data can be very useful to select pharmaceuticals for monitoring
and to predict wastewater concentrations. Measured influent concentrations were on average 78% with a range
of 31–138% of predicted influent concentrations. Metformin is the pharmaceutical with the highest concentra-
tion in wastewater (64–98 μg/L) but it is removed with >98% in sewage treatment plants (STP). Guanylurea, a
biodegradation product of metformin, was detected in STP effluents and surface waters at concentrations of
39–56 μg/L and 1.8–3.9 μg/L, respectively. The STP removal of the different pharmaceuticals varied strongly.
Consumption based monitoring
For carbamazepine, hydrochlorothiazide and sotalol a significant better removal was found at higher tempera-
Regional surface water
tures and longer hydraulic retention times while for metoprolol significantly better removal was only observedat higher temperatures. Predicting environmental concentrations from regional consumption data might be analternative to monitoring of pharmaceuticals in wastewater and surface waters.
Crown Copyright 2012 Published by Elsevier B.V. All rights reserved.
environment is difficult to assess. Acute aquatic risks are usually esti-mated by assessing the ratio of the predicted environmental concentra-
Over the last two decades, numerous articles have been published on
tion and the predicted no-effect concentration (PEC/PNEC). For a large
pharmaceuticals in the environment. These studies show that a mixture
number of pharmaceuticals, these ratios have been reviewed by Fent
of different pharmaceuticals is present in wastewaters and surface wa-
et al. (2006). Observed ratios were generally far below 1 indicating
ters (Daughton and Ternes, 1999; Sacher et al., 2008; Roig, 2010). The
that there is a limited risk based on the effects of individual pharmaceu-
presence of pharmaceuticals and personal care products in surface wa-
ticals. However, it should be noted that eco-toxicological data are still
ters has given rise to concern about ecological and human health risks.
limited (Fent et al., 2006). Especially for chronic toxicity data that con-
Concentrations in surface waters generally fall in the ng/L to μg/L
sider effects of exposure during multiple life stages or even multiple
range. At these concentrations, human health effects are not expected
generations are lacking and little is known about effects of mixtures of
(Bruce et al., 2010). Whether these concentrations pose a threat to the
pharmaceuticals (Roig, 2010).
Currently, pharmaceuticals such as β-blockers, analgesics, antibi-
otics, lipid regulators, and X-ray contrast media have been monitored
⁎ Corresponding author at: Water Board Regge en Dinkel P.O. Box 5006, 7600 GA Almelo,
The Netherlands. Tel.: +31 546832993.
and detected in wastewaters (Kasprzyk-Hordern et al., 2007;
E-mail address: [email protected] (M. Oosterhuis).
Radjenovic et al., 2007; Miege et al., 2008; Flyborg et al., 2010; Rosal et
0048-9697/$ – see front matter. Crown Copyright 2012 Published by Elsevier B.V. All rights reserved.
http://dx.doi.org/10.1016/j.scitotenv.2012.10.046
Author's personal copy
M. Oosterhuis et al. / Science of the Total Environment 442 (2013) 380–388
al., 2010; Hörsing et al., 2011) and surface waters (Jones et al., 2002;
were subsequently monitored in sewage influents, sewage effluents
Kasprzyk-Hordern et al., 2007). Some pharmaceuticals have also been
and receiving surface waters.
found in drinking water produced from surface water (Huerta-Fontela
The aim of the study was to investigate the local emission of pharma-
et al., 2011; Sanderson, 2011) and river bank filtrate (De Jongh et al.,
ceuticals to regional surface waters. Well defined consumption data of
pharmaceuticals in a catchment of a sewage treatment plant and knowl-
Monitoring of pharmaceuticals in the environment is restricted by the
edge on the sewage treatment plant efficiencies enable one to relate con-
available analytical techniques in laboratories. The selection of pharma-
sumption to loads of pharmaceuticals in sewage influent, removal by
ceuticals for monitoring is often based on selections of pharmaceuticals
wastewater treatment, loads and concentrations in effluents, and loads
analyzed in previous studies. Consequently, some pharmaceuticals, that
and concentrations in receiving waters. The monitoring was performed
might be relevant based on their consumption, human excretion and pas-
in September–October and December 2010 in a sewage treatment plant
sage of sewage treatment, might be omitted in current environmental
with a parallel operated conventional activated sludge system (CAS)
monitoring studies. There are, for example, many data on the occurrence
and a membrane bioreactor (MBR). This additionally allowed the com-
and fate of the anti-epileptic carbamazepine and the β-blockers metopro-
parison of removal rates of pharmaceuticals at different wastewater tem-
lol, sotalol and atenolol in the water cycle, while only few data exist on
peratures and with different sewage treatment technologies, varying in
other widely used pharmaceuticals such as metformin (anti-diabetic),
hydraulic retention time (HRT), sludge concentration and type of solids
irbesartan (anti-hypertensive) and hydrochlorothiazide (diuretic). The
fact that certain pharmaceuticals have not been included in watercatchment-studies might result in an underestimation of the total con-
2. Materials and methods
centrations and annual fluxes of pharmaceuticals in surface waters andcan affect the risk assessment as some relevant pharmaceuticals might
2.1. Selection of pharmaceuticals
be ignored. Besides occurrence, human excretion and removal bywastewater treatment plants, prescription (or sales) data are suitable
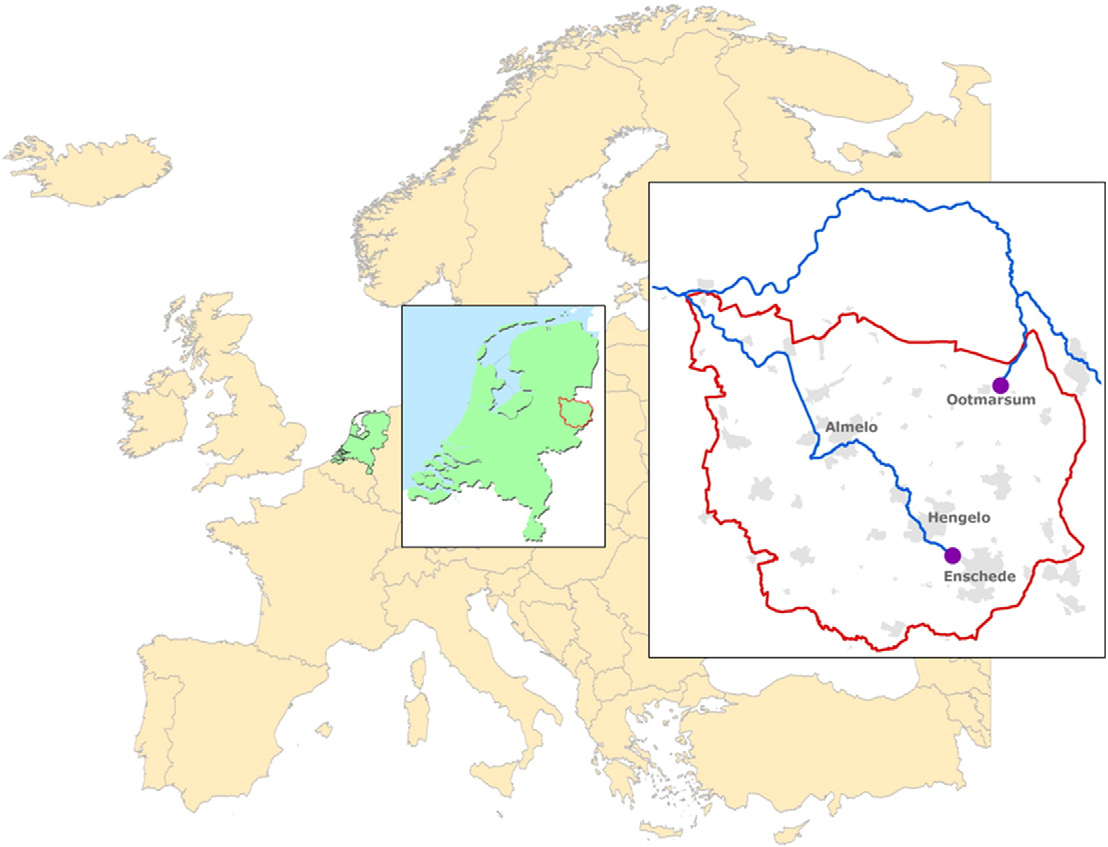
For the village of Ootmarsum (7220 inhabitants) and the city of En-
to select relevant pharmaceuticals for environmental monitoring (de
schede (157,052 inhabitants) (Fig. 1) the top-50 of most sold pharma-
Voogt et al., 2009) and predict environmental concentrations. Jones et
ceuticals by local pharmacies (2009) was extracted from a database of
al. (Richardson and Bowron, 1985; Jones et al., 2002; Siemens et al.,
the Dutch foundation of pharmaceutical numbers (SFK). The sales data
2008) used average consumption of the 25 most prescribed pharma-
were reported in defined daily doses per year (DDD/yr). It was assumed
ceuticals in the UK to predict environmental concentrations. Further-
that sales and consumption were equal. Sales of pharmaceuticals via
more, Alder et al. (2010) predicted surface water concentrations of
local hospital pharmacies were not included in the data of the SFK. How-
four β-blockers within a factor of two in the Swiss Glatt Valley from na-
ever, it was assumed that the contribution of hospital pharmacies to the
tional consumption data and measured removal efficiencies in three
total load was marginal since most pharmaceuticals, except some antibi-
sewage treatment plants (STPs). Discrepancies between predicted and
otics and X-ray contrast media, are mainly acquired via generic pharma-
measured concentrations were explained by higher biodegradation
cies (Derksen et al., 2007; Ort et al., 2010a; Vergouwen et al., 2011a). The
and photolysis in summer time when residence times of the water in
load of pharmaceuticals to the STP was calculated by use of an excretion
the valley were 100–200 days. Additionally, Scheurer et al. (2009) de-
factor and an average daily dose.
scribed the occurrence of the widely used pharmaceutical metforminin German surface waters and reported that the high concentrations
Consumption Enschede g
correlated well with consumption data. Finally, ter Laak et al. (2010) re-
nr persons Enschede
lated the loads of pharmaceuticals in the river Rhine to the upstreamconsumption of these pharmaceuticals in the Rhine catchment area
Load to STP Enschede g
=yrÞEnschede $ ðg=DDDÞ $ excretion
and could explain the loads of 15 out of the 20 most frequently detected
pharmaceuticals within a factor of two.
The literature data above illustrate that, among other criteria, in-
Table 1 lists the nine pharmaceuticals selected for monitoring. The
ternational or national sales data of pharmaceuticals can be valuable
predicted emission was based on sales, excretion rate and STP remov-
to select relevant pharmaceuticals for monitoring and can be used
al rate, and analytical methods available. Initially, furosemide and
to estimate loads and average environmental concentrations in sur-
omeprazol were also selected for monitoring based on their predicted
face waters. However, as consumption of pharmaceuticals can differ
emissions. However, no analytical techniques were available, so these
on a regional basis they are less suitable to predict loads or concentra-
pharmaceuticals could not be included in the current study. The high
tions in wastewater and regional surface water systems.
predicted consumption and emission of furosemide and omeprazol
To our knowledge hardly any studies have been conducted in which
give rise to studying these pharmaceuticals in the future.
regional sales of pharmaceuticals within catchments of a wastewatertreatment plant have been related to measured concentrations and
2.2. Sewage treatment plants
loads of these pharmaceuticals in the wastewater influent, effluentand the receiving surface waters. This approach can be very useful as
The sewage treatment plants of Enschede (circa 50,000 m3/d) and
it links the local consumption (i.e. sales) in households to concentra-
Ootmarsum (circa 2500 m3/d) both consist of a conventional activated
tions in wastewater and surface water. Thereby the input of the system
sludge system (CAS) with biological phosphate removal and nitrogen
is better defined, allowing descriptive modeling. Furthermore, results
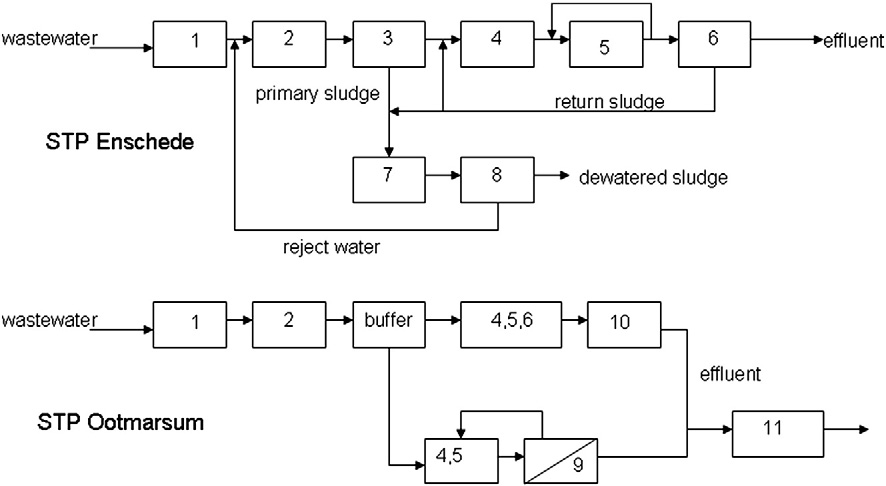
removal via nitrification/denitrification. At STP Enschede, the wastewa-
might be useful for the prediction of loads of pharmaceuticals in other
ter passes primary clarifiers, anaerobic tank, denitrification tank, nitrifi-
cation tank and secondary clarifiers. The secondary and primary sludge
In this study, local sales data of pharmaceuticals in a village and a city
is digested in mesophilic sludge digesters and the digested sludge is
in the Netherlands, and information on human excretion and removal
centrifuged to remove excess of water. This ‘reject water' is mixed up
during wastewater treatment were used to select pharmaceuticals for
with the raw wastewater. Ferric chloride is added to the reject water
monitoring. Besides that, guanylurea, a transformation product of met-
to remove released phosphate (Fig. 2).
formin, was selected for monitoring because recent literature showed
STP Ootmarsum consists of a combination of a MBR and a CAS sys-
that this product was formed during wastewater treatment and observed
tem with sand filtration as post treatment. MBR and CAS with sand fil-
in surface waters (Scheurer et al., 2009; Trautwein and Kümmerer,
tration are operated in parallel. The HRT in the MBR is 19±4 h while
2011). The pharmaceuticals with presumably the highest emissions
the HRT in the CAS is three times longer (61±13 h). Under dry weather
Author's personal copy
M. Oosterhuis et al. / Science of the Total Environment 442 (2013) 380–388
Table 1Consumption and human excretion of the selected pharmaceuticals.
Sales g/person/year
Human excretion (%)
Predicted emission to the STP kg/yre
a Data obtained from Roig (2010).
b Data obtained from www.fk.cvz.nl (accessed: January 2010).
c Data obtained from Lienert et al. (2007).
d No data available.
e Predicted emissions are calculated by multiplying the number of prescriptions with a defined daily dose (mg/d) and the human excretion.
conditions, 50% of the wastewater is treated in the MBR and the
1st. Additionally, on December the 7th, 8th and 9th grab samples were
other 50% is treated in a CAS system with sand filtration. During storm
taken from effluent receiving surface water, 2.5 km downstream from
rainfall circa 77% of the wastewater is treated in the CAS system since
the discharge of effluent of STP Ootmarsum. The total hydraulic reten-
the hydraulic capacity of the MBR is limited to 150 m3/h. After
tion time in the surface water, including the wetland from STP
treatment the effluent of STP Ootmarsum passes a wetland with a hy-
Ootmarsum to the point where the samples were taken was approxi-
draulic retention time of 4 days. Fig. 2 shows the flow diagrams of STP
mately four days. This allows mixing and homogenization of daily vari-
Enschede and STP Ootmarsum. The wastewater and effluent character-
ations of loads of pharmaceuticals from the effluent (Radke et al., 2010).
istics of both STPs are presented in Table S1 of the Supplemental
Therefore, grab samples were considered to represent the average con-
centration in the surface water which enabled to calculate loads. Allsamples were stored at 4 °C and processed within one week.
Flow proportional 24 h samples were taken from the raw wastewa-
ter and from effluent of STP Ootmarsum at September the 4th and 19th,
Determination of all pharmaceuticals and metabolites was done
October the 5th and December the 7th, 8th and 9th 2010. The STP En-
using HPLC/MS–MS analysis after automated solid phase extraction
schede was sampled at September the 1st and 9th and October the
(SPE) of the analytes. The target analytes were selected based on sales
Fig. 1. Sampling locations.
Author's personal copy
M. Oosterhuis et al. / Science of the Total Environment 442 (2013) 380–388
Fig. 2. Simplified flow scheme of STP Enschede and STP Ootmarsum. Legend: 1) grid removal, 2) sand trap, 3) primary clarifiers, 4) selector+anaerobic tank, 5) denitrification and nitrification,6) secondary clarifiers, 7) sludge digestion, 8) sludge dewatering, 9) UF membranes, 10) sand filtration, 11) and wetland passage.
and consumption data. Several existing methods were applied to tackle
For analysis of metoprolol and sotalol, the samples were adjusted to
the analysis of the chemically diverse set of target compounds. Prior to
a pH of 7 (if necessary) and spiked with clenbuterol-d9 and sotalol-d6 as
analysis, wastewater samples were diluted with tap water that was free
internal standards. Solid-phase extraction was done on Bond Elut PPL
of pharmaceuticals to reduce matrix effects.
material (200 mg) from Agilent Technologies. Again, the eluate was
Carbamazepine, diclofenac, irbesartan, losartan and valsartan were
evaporated to dryness and reconstituted with 50 μL methanol and
analyzed following a method that is described in detail in Sacher et al.
50 μL of a 95:5 (v:v) mixture of a 20 mM aqueous ammonium acetate
(2008). The water samples were adjusted to a pH of 3 by addition of
solution and acetonitrile. An aliquot was injected into the HPLC/MS–
hydrochloric acid. Then carbamazepine-d10, diclofenac-d4, valsartan-
MS system (HPLC HP 1100 from Agilent Technologies and API 2000
d3, irbesartan-d3 and ibuprofen-d3 were added as internal standards.
mass spectrometer from AB Sciex). Separation of the analytes was
Solid-phase extraction was done on plastic cartridges filled with
achieved on a Nucleosil column (250 mm×2 mm, 3 μm) from Bischoff
200 mg of Bakerbond SDB 1 material (Mallinckrodt Baker, Deventer,
Chromatography (Leonberg, Germany). Injection volume was 12.5 μL
The Netherlands). The SPE material was dried for 60 min in a gentle
and flow rate of the eluent was 0.2 mL/min. Gradient elution was ap-
stream of nitrogen and elution was done with 10 mL acetone. The sol-
plied with a 20 mM ammonium formate solution in MilliQ water and
vent was evaporated to dryness in a stream of nitrogen and the dry res-
with a 20 mM ammonium formate solution in a 2:1 (v:v) mixture of
idue was reconstituted with 50 μL methanol and 50 μL HPLC grade
acetonitrile and methanol. An electrospray interface was used and MS
water. An aliquot was injected into the HPLC/MS–MS system (HPLC HP
detection was done in the positive ionization mode with an ionization
1100 from Agilent Technologies, Waldbronn, Germany and API 2000
voltage of +5500 V. For MS–MS detection the MRM mode was used.
mass spectrometer from AB Sciex, Langen, Germany). For HPLC separa-
Metformin and guanylurea were analyzed by a method described in
tion a Luna C18 column (250 mm×2 mm, 5 μm particle size) from
detail by Scheurer et al. (2009). Briefly, this method consists of a
Phenomenex (Aschaffenburg, Germany) was used. Injection volume
pre-concentration of the analytes from the water samples at neutral
was 12.5 μL and flow rate of the eluent was 0.2 mL/min. Gradient elu-
pH onto Strata X-CW material from Phenomenex. Metformin-d6 was
tion was applied with a 20 mM ammonium formate solution in MilliQ
used as internal standard and elution of the analytes from the SPE ma-
water and with a 20 mM ammonium formate solution in a 2:1 (v:v)
terial was done with 5 mL of a methanol/acetonitrile mixture (20:80,
mixture of acetonitrile and methanol. An electrospray interface was
v:v) containing 2% formic acid. After elution the solvent was evaporated
used and MS detection was done in the positive ionization mode with
to dryness in a stream of nitrogen and the dry residue was reconstituted
an ionization voltage of +5500 V. For MS–MS detection the MRM
in a mixture of 50% HPLC grade water and 50% acetonitrile. Then 10 μL
(multi reaction monitoring) mode was used.
was injected into the HPLC tandem–MS system (1200 HPLC system
Hydrochlorothiazide was analyzed with a similar method as the
from Agilent Technologies and 4000 Q-Trap Triple–Quadrupole mass
one previously described. The samples were adjusted to pH 3 and
spectrometer from AB Sciex with an electrospray interface operated in
hydrochlorothiazide-13C-d2 was added as internal standard. For
positive ionization mode). HPLC separation took place on a ZIC-HILIC
pre-concentration of the analyte 200 mg SPE material Strata X from
column (150×2.1 mm, 3.5 μm) from Merck SeQuant AB (Umeå,
Phenomenex was used and elution was done with 5 mL methanol
Sweden). Gradient elution was applied with an aqueous 10 mM ammo-
and subsequently with 1 mL acetone. The solvents were evaporated
nium formate solution set to pH 3 with concentrated formic acid and
to dryness and reconstituted with 20 μL methanol and 80 μL HPLC
with acetonitrile. Flow rate was 0.35 mL/min. MS–MS detection was
grade water. An aliquot was injected into the HPLC/MS–MS system
again done in the MRM mode.
(HPLC 1200 SL from Agilent Technologies and API 4000 mass spec-
Isotope-labeled standards were used whenever available. If no
trometer from AB Sciex). HPLC separation was done on a Gemini col-
labeled standard was available similar isotope-labeled compounds
umn (250 mm×2 mm, 5 μm) from Phenomenex. Injection volume
were used to correct for extraction recoveries and analytical
was 20 μL and flow rate of the eluent was adjusted to 0.3 mL/min.
variations (e.g. ionization effects). The labeled compound that
For gradient elution a 20 M ammonium formate solution in MilliQ
showed the most similar ‘analytical behavior' to the target compound
water and a 2 mM ammonium formate solution in a 2:1 (v:v) mixture
was used as internal standard. For carbamazepine, diclofenac, valsartan,
of acetonitrile and methanol were used. MS detection of hydrochloro-
irbesartan, sotalol and metformin deuterated analogs were used as
thiazide was done in the negative ionization mode with an ionization
internal standard. For hydrochlorothiazide a 13C labeled and deuterated
voltage of −4500 V. MS–MS detection was again done in the MRM
internal standard was used. For metoprolol, isotope-labeled clenbuterol
was used as internal standard, for guanylurea metformin-d6 was used,
Author's personal copy
M. Oosterhuis et al. / Science of the Total Environment 442 (2013) 380–388
while for losartan valsartan-d3 was used. For all methods calibrations
Supplemental Information) at the STPs. Due to varying influent concen-
were made for the overall procedure from tap water. Validation parame-
trations and wastewater flows the STPs are not at steady state, and re-
ters characterizing the performance of the analytical methods used are
moval efficiencies can change from day to day. Furthermore the HRT
summarized in Table S8 in the Supplemental Information. Validation
exceeded one day. Therefore, the concentrations and related removal
was done in surface water to account for the matrix effects occurring in
efficiencies in Table 2 are based on average mass flows of influent and
the samples analyzed in this study (surface water and diluted wastewa-
effluent (mg/d) and average wastewater flows (m3/d) over the sam-
ter). The validation data prove that the methods are well suited for the
pling period (Ort et al., 2010b). Additionally, it should be noted that
application in the monitoring campaign. Analytical uncertainties are in
the analytical uncertainty is estimated to be 20–30% so minor differ-
the range of 20 to 30% for all compounds under investigation.
ences between influents and effluents or between predicted and mea-sured values can be attributed to analytical uncertainties. The
3. Results and discussion
standard deviation of the influent and effluent concentrations repre-sents the variation observed between the individual 24 h composite
3.1. Consumption and emission
samples. The individual data are presented in the Supplemental Infor-mation, Table S3–S7.
Table 1 shows the consumption data of pharmaceuticals for the
The predicted concentrations in the influents are generally slightly
city of Enschede and the village of Ootmarsum, extracted from the da-
higher than the measured concentrations. Measured concentrations
tabase of the SFK. The emission is predicted from the consumption of
were on average 78% with a range of 31–138% of predicted concentra-
the patients living in the zip code area that was covered by the re-
tions. Loads of sotalol for Enschede and valsartan for Ootmarsum
spective STPs.
could not be predicted as regional consumption data were not available.
Various discrepancies can exist between the predicted consumption
This shows that the consumption based prediction is rather accurate.
and the actual consumption. First, differences between predicted and
Differences between predicted and observed concentrations in the in-
observed concentrations in the influents can be attributed to incomplete
fluents can be attributed to incomplete use of sold pharmaceuticals, ad-
use of prescribed and sold pharmaceuticals (Ruhoy and Daughton,
ditional consumption from hospital pharmacies not included in this
2008; Musson and Townsend, 2009). This so called medication compli-
study (Vergouwen et al., 2011b), transformation of pharmaceuticals
ance for cardiovascular pharmaceuticals has been estimated to be 71%
during sewer passage, temporal variations in pharmaceutical consump-
(Claxton et al., 2001). Secondly, sales data do not account for pharma-
tion (ter Laak et al., 2010) and analytical uncertainties (Ort et al.,
ceuticals obtained from other sources due to consumption of pharma-
2010b). A more detailed discussion on the predicted concentrations,
ceuticals obtained from other regions or illegal use. Finally, temporal
measured concentrations and removal during sewage treatment for
(seasonal) trends in consumption of pharmaceuticals such as antibi-
the individual pharmaceuticals is given below.
otics, anti viral drugs and analgesics can lead to corresponding trendsin emissions and loads in surface waters (Singer et al., 2008; ter Laak
3.3. STP removal of pharmaceuticals
et al., 2010). Together, these discrepancies can bias predicted emissionsresulting in differences between predicted and observed loads of phar-
Table 3 presents removal efficiencies at STP Ootmarsum at different
maceuticals in the STPs or surface waters.
temperatures and HRTs. It can be observed that for some pharmaceuti-
It can be observed that the predicted emission of metformin is very
cals the removal efficiency increases with increasing temperature and
high compared to other pharmaceuticals. This is due to its large share of
HRT. The results of the individual pharmaceuticals are discussed below.
users (>3.5% of the Dutch population), its high daily dose of 2000 mg/dand 100% excretion by humans.
3.4. Metoprolol and sotalol
Table 1 and Table S2 of the Supplemental Information show only
marginal differences in consumption of pharmaceuticals between En-
The measured influent concentrations of the two β-blockers meto-
schede and Ootmarsum or between the Dutch average and these loca-
prolol and sotalol of STP Ootmarsum are 31±7% higher than predicted
tions. Consumption patterns of the studied region were generally
wastewater concentrations based on regional consumption data. These
rather similar to the average Dutch consumption, despite the observa-
marginal differences could be explained by analytical uncertainties,
tion from a national survey on pharmaceutical consumption in the
minor changes in consumption between 2009 and 2010 and additional
Netherlands of Van den Berg Jeths and Van Batenburg-Eddes (2003),
consumption from hospital pharmacies.
which showed that there can be large regional variations in the con-
The β-blockers are only partly removed in the STP of Ootmarsum
sumption of pharmaceuticals. If the regional and Dutch consumption
and Enschede. The performance of the CAS system of Enschede and
data are compared to European averages, larger differences are ob-
STP Ootmarsum reveals no significant differences (Table 2). The remov-
served. The consumption of carbamazepine, ketoprofen and bezafibrate
al rate of metoprolol appeared slightly higher than that of sotalol in both
is considerably lower than elsewhere in Europe, while the consumption
STPs. Typically, the opposite is reported in literature (Vieno et al., 2007;
of furosemide, valsartan, irbesartan, metoprolol and metformin largely
Roig, 2010). However, Roig mentions that the collected data lack STPs
exceeds the average European consumption.
with hydraulic retention times >25 h and sludge retention times
Five of the six pharmaceuticals with the highest predicted emissions
>20 d. Both STPs in the current study have a hydraulic retention time
show consumptions that exceed European averages (Table 1). More-
>25 h and sludge retention times >20 d. Additionally, Maurer et al.
over, the consumption of pharmaceuticals is likely to increase in the
(2007) showed that removal of β-blockers by sorption to activated
coming decades due to aging populations (van der Aa et al., 2011).
sludge is negligible and that degradation rate constants of metoprolol(0.58 L/d/gCOD) were twice as high as for sotalol (0.29 L/d/gCOD). This
3.2. Measurements in wastewater and surface water
corresponds to the observed higher removal rate of metoprolol.
The STP of Ootmarsum, where a conventional activated sludge system
Based on the consumption data, metformin, valsartan, losartan,
and a Membrane Bioreactor are operated in parallel, was sampled in
irbesartan, metoprolol, sotalol, carbamazepine and diclofenac were
September–October and December (Fig. 2). The removal in September–
monitored in raw wastewater, effluent and receiving surface water.
October was significantly higher than in December for both β-blockers
Table 2 presents predicted influent concentrations in raw wastewater
(Table 3). This illustrates that the removal is more effective at higher tem-
(i.e. the calculated daily emission divided by average wastewater flow
peratures, which is probably due to higher biological activity. Additional-
on the sampling days), average measured influent and effluent concen-
ly, a significantly better removal by the MBR was observed for metoprolol,
trations and average removal efficiency calculated from these (see
while the removal of sotalol was more effective in the conventional
Author's personal copy
M. Oosterhuis et al. / Science of the Total Environment 442 (2013) 380–388
Table 2Predicted and measured concentrations in wastewater influent and effluent of STPs Enschede and Ootmarsum and recovered amount in surface water. Standard deviations aregiven in brackets.
Predicted influent Influent
Recovery surface water b Predicted influent Influent
Hydrochlorothiazide 1.90
84.41 (13.61) 1.22 (0.50)
0.14 (0.07)h 95% (2%)
a The calculation of average removal and standard deviations is explained in the supplemental information.
b Recovery of pharmaceuticals in surface water in December compared to effluent load (i.e. (flow∗conc. surface water)/(flow∗conc. effluent)), see Table S7 of the Supplemental
Information for individual data.
c Not detected.
e Cannot be calculated.
f Not measured.
g No individual consumption data available, calculated from average Dutch consumption.
activated sludge treatment. This difference is difficult to interpret. The
mixed liquor suspended solids (g/L) in the MBR is 2.4 times higherwhile the hydraulic retention time is 3.2 times shorter than in the CAS
The concentrations of diclofenac observed in the influents are 72%
system. It is unlikely that the higher removal of metoprolol in the MBR
and 58% of the predicted average concentrations for Ootmarsum and
system can be attributed to sorption to the higher suspended solids
Enschede and the removal of diclofenac is −9% and 41% in the STPs of
load, as sorption coefficient of metoprolol to sewage sludge is too low
Ootmarsum and in Enschede, respectively. The removal efficiency did
to allow significant removal, even in the MBR system (Maurer et al.,
not change significantly with temperature or hydraulic retention time.
2007). Possibly, the removal of sotalol is improved by longer hydraulic re-
The poor removal efficiency of diclofenac observed in both treatment
tention that promotes a microbial community that is more effective in
systems is in line with literature data (Roig, 2010). The effluent concen-
degrading sotalol, while the microbial community in the MBR is more
trations of diclofenac are within the range of mean environmental con-
suitable for metoprolol removal. More detailed studies on the (microbial)
centrations reported in Europe: 0.03–1.8 μg/L. This corresponds to the
removal efficiency of the parallel MBR and CAS treatment in Ootmarsum
regional consumption of diclofenac, which is similar to the average
are necessary to generate conclusive results.
European consumption (Table 1). The recovery of diclofenac in surface
The concentrations of the β-blockers in the effluents of the two Dutch
water was 131% of the calculated emission. This shows that diclofenac
STPs are higher than the mean European effluent concentrations (meto-
is persistent in the aquatic environment.
prolol (0–0.8 μg/L), sotalol (0.18–0.87 μg/L)). This can be explained bythe regional and national Dutch consumption of metoprolol and sotalol
3.6. Carbamazepine
that both exceed the European average (see Table 1 and Table S2 ofthe Supplemental Information). The recoveries of metoprolol and sotalol
The measured influent concentrations of carbamazepine in
in surface waters (residence time of water 4 days) were 93% and 89% of
Ootmarsum and Enschede were respectively a factor 3 and 2 lower
the calculated emission, respectively. This illustrates that removal due to
than the predicted influent concentrations. It should be mentioned
biodegradation and sorption in surface waters is low. However, sampling
that the excretion of carbamazepine was set at 26% While Lienert et
of surface water and effluent was done at the same time so the recover-
al. (2007) reports 2% excretion of unmetabolized carbamazepine via
ies could not be determined exactly.
urine and 24% excretion of an unknown mixture of metabolites andparent compound via feces. The excretion of unchanged carbamaze-pine is therefore unknown and does not allow prediction of the influ-
ent concentration on the basis of consumption and average excretion.
Removal of pharmaceuticals at STP Ootmarsum at different wastewater temperatures
Carbamazepine is one of the most studied pharmaceuticals and is
and hydraulic retention times.
known to be very persistent. 43 of 48 records collected by Roig (2010)
showed removal efficiencies below 20%. Our data are in line with the lit-
erature data reported, with average removal efficiencies of 10% and 3% in
Ootmarsum and Enschede respectively. Even though removal was mar-ginal, detailed studies of the STP Ootmarsum show a significantly more
effective removal in September–October than in December (Table 3).
Furthermore, the conventional activated sludge system appeared to be
significantly more effective than the MBR system (Table 3). This suggests
that the longer residence time of the activated sludge in the convention-
al system enables higher biodegradation. Despite the marginal removal
of carbamazepine, effluent concentrations are relatively low compared
to other European countries (0.2–0.5 μg/L versus 0.2–1.2 μg/L). This is
a Significant differences in removal with temperature or HRT (pb0.01).
in line with the consumption per capita that is approximately half of
b Significant differences in removal with temperature or HRT (pb0.05).
the European average (Table 1). Due to the rather low concentrations
Author's personal copy
M. Oosterhuis et al. / Science of the Total Environment 442 (2013) 380–388
in the effluent and high dilution in receiving waters, carbamazepine was
from 7 to 43 mg/L, while Rosal et al. reported 53% removal in a CAS-
not detected in the receiving surface water. Thus the recovery in surface
system with lower effluent NH4–N levels of 8.5 mg/L and presumably
water could not be determined.
better nitrification (Rosal et al., 2010). Nitrification capacity is mainly re-lated to the hydraulic and solid retention times and oxygen concentra-
3.7. Losartan, irbesartan and valsartan
tion in an STP. Together, this suggests that higher temperatures andlonger hydraulic retention times in the conventional system enable
The predicted concentration of losartan exceeds the measured
higher biodegradation of hydrochlorothiazide. The recovery of hydro-
concentrations by a factor of 2 to 3. This deviation might be attributed
chlorothiazide in surface water was 71%. Possibly some of the hydro-
to removal in the sewer system before entering the STP as the high
chlorothiazide was degraded in surface water during 4 days retention
removal rate during treatment suggests that this compound is readily
time. However, sampling of surface water and effluent was done at
biodegradable. Furthermore, cardiovascular medication is known to
the same time so the recoveries could not be determined exactly.
have relatively low medication compliance (Ruhoy and Daughton,2008; Musson and Townsend, 2009), which means that less pharma-
3.9. Metformin and guanylurea
ceutical is actually consumed than sold. Together, these factors mightexplain the overestimation of influent concentrations.
Metformin is an anti-diabetic drug that is widely used in Europe
Irbesartan shows a poor removal rate (−42% to 6%), while losartan
(OECD, 2009). It is probably the pharmaceutical with the highest emis-
and valsartan are removed to a larger extent (88–97%) in the STP.
sion to the environment on a mass basis (Scheurer et al., 2009). The av-
The removal efficiency of losartan, irbesartan and valsartan did not
erage concentration of metformin in raw wastewater of Enschede and
change significantly with sludge temperature or hydraulic retention
Ootmarsum was 79±12 μg/L. This is similar to observations from litera-
time. Very few literature data are available on STP removal of losartan
ture that ranged from 57 to 129 μg/L (Scheurer et al., 2009; Trautwein
and valsartan. However, Batt et al. (2008) reported 62% removal of
and Kümmerer, 2011; Scheurer et al., 2012). These concentrations ex-
losartan and Kasprzyk-Hordern et al. (2008) reported 84% removal of
ceed concentrations of the other pharmaceuticals by roughly 2 orders
valsartan in a CAS system and 44% valsartan removal in a trickling filter.
of magnitude. Furthermore around 60% of the consumed metformin
The observed removal rates in our study are higher (88–97%). The differ-
was recovered in the STP influent. The marginal overestimation of the
ence between the trickling filter and CAS system observed by Kasprzyk-
metformin concentrations might be attributed to known low compliance
Hordern suggests that solids and hydraulic retention time are both rele-
of medication for the alimentary tract (Ruhoy and Daughton, 2008) and
vant for the removal of valsartan and possibly also for losartan.
analytical uncertainties. The major fraction of metformin is removed
To our knowledge there is no literature data available on the
during wastewater treatment (97.8±1.0%) in the STPs, which is in line
removal of irbesartan in STPs. However, the very low adsorption coef-
with the literature (Scheurer et al., 2009; Trautwein and Kümmerer,
ficients to secondary sludge for irbesartan according to Hörsing et al.
2011). No significant difference in removal was observed between the
(2011) (Kf=5.3∗10−4 L/g) suggest that irbesartan is practically not
STPs of Enschede and Ootmarsum and the removal efficiency did not
removed by sorptive processes in activated sludge. Huerta-Fontela
change significantly with temperature or hydraulic retention time.
et al. (2011) show that 19% of irbesartan even passes advanced treat-
Furthermore, guanylurea, a biodegradation product of metformin,
ment techniques, such as chlorination, sand filtration, ozonation and
was detected at an average concentration of 48 μg/L in the effluent of
granulated activated carbon filtration, applied for drinking water pro-
STP Ootmarsum. Trautwein and Kümmerer (2011) reported the forma-
duction. The poor removal rate of irbesartan (−42% to 6%), shows
tion of guanylurea in laboratory biodegradation studies and their occur-
that sewage treatment techniques are not effective in removing this
rence in STP effluents. However, concentrations in these effluents were
compound from wastewater. The recovery of irbesartan in surface
more than one order of magnitude lower than those observed in the
water was 98% which illustrates that irbesartan is also persistent in
current study, even though influent concentrations of metformin were
surface water. Losartan and valsartan could not be detected in surface
similar. On the other hand Scheurer et al. (2012) reported STP effluent
water, so their recoveries in surface water could not be determined.
concentrations between 18 and 99 μg/L which are similar to concentra-
For irbesartan, its poor removal efficiency in STPs, its resistance to
tions observed in the present study.
advanced oxidation and adsorption by activated carbon and the limited
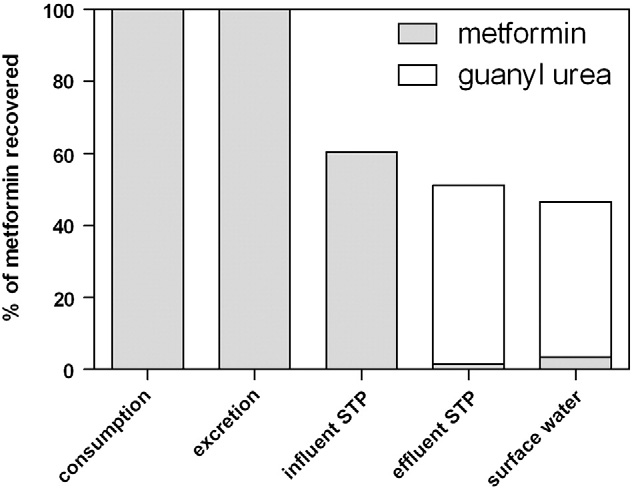
Fig. 3 relates consumption of metformin and guanylurea to recovery
literature data on occurrence and environmental risks suggest to fur-
in raw wastewater, effluent and surface water in Ootmarsum. 82±52%
ther study the fate and risks of this pharmaceutical in the water cycle.
of the degraded metformin can be recovered as guanylurea after the
3.8. Hydrochlorothiazide
The predicted influent concentrations of hydrochlorothiazide in
Ootmarsum and Enschede of 1.9 and 1.8 μg/L are respectively 15% and22% higher than the measured influent concentrations. These marginaldifferences could be explained by analytical uncertainties, and incom-plete use of sold medication or minor changes in consumption between2009 and 2010.
The STPs of Ootmarsum and Enschede removed on average 23% and
31% of the diuretic drug hydrochlorothiazide, respectively. Observed re-moval rates fall into the broad range reported in the literature that spansfrom 0 to 77% (Castiglioni et al., 2004; Radjenovic et al., 2007). Detailedstudies of the STP Ootmarsum show a significantly more effective re-moval in September–October (43±17%) while the removal in Decem-ber was negligible (3±17%) (Table 3). Furthermore, the conventionalactivated sludge system appeared to be significantly more effectivewith an average removal of 31±25% than the MBR system with a re-moval of only 9±26% (Table 3). These observations are in line withthe literature. Radjenovic et al. (2007) reported 0% removal of hydro-chlorothiazide in a STP with effluent NH4–N concentrations ranging
Fig. 3. Fate of metformin from consumption to surface water in Ootmarsum.
Author's personal copy
M. Oosterhuis et al. / Science of the Total Environment 442 (2013) 380–388
activated sludge taking into account the molecular weight ratio of
literature might be applicable to predict STP effluent and surface water
guanylurea and metformin. Furthermore metformin and guanylurea
concentrations. However, the variation observed for the removal of cer-
were monitored in receiving surface waters. 87% of the effluent load of
tain compounds reported in the literature, as well as significantly differ-
guanylurea could be recovered in the surface water showing that
ent removal rates at different temperatures and hydraulic retention
guanylurea is recalcitrant in surface water. The recovery of metformin in
times in this study illustrate that emissions do vary within STPs and be-
surface water exceeded 100% by nearly a factor two (187%). The apparent
tween STPs. Removal efficiencies for carbamazepine, hydrochlorothia-
increase of the effluent load of metformin from effluent to surface water
zide and sotalol increased with wastewater temperature and hydraulic
can probably not be attributed to grab sampling of the surface water, as
retention time (Table 3). When the effects of temperature and hydraulic
potential daily variations of concentrations of metformin are averaged
retention time on removal of pharmaceuticals in STPs are taken into ac-
by one day retention in the treatment system and four days retention in
count, a more accurate prediction of effluent and surface water concen-
the wetland system and surface water. However, biological degradation
trations is possible.
efficiency in CAS and MBR systems can vary in time (Tchobanoglous et
The recovery of most pharmaceuticals in surface water after 4 days
al., 2003). This might explain that the recovery in surface water exceeded
retention was high (71–187%) which suggests that the pharmaceuticals
100%, as the concentrations in the surface water originate from emissions
are persistent in the aqueous environment. However, the recovery in
with a different ratio of metformin and guanylurea four days earlier.
surface water was studied in December at low temperatures and is not
The number of users of metformin in the Netherlands increased with
representing the average situation. Finally, a remarkable result of this
34% from 2006 to 2010 (GIP, health insurance college, www.gipdatabank.
study was that circa 50% of the consumed metformin could be recovered
nl, accessed April 2012). The consumption of metformin is expected to
as guanylurea in surface water.
grow as the number of people which suffer from diabetes increases in
It has to be emphasized that sales data do not give any information
the future (van der Aa et al., 2011). The high and increasing consumption
on possible ecotoxicological or human health risks of pharmaceuticals.
of metformin and the formation of the recalcitrant guanylurea advocates
So in addition to the consumption based assessment of the emissions
further research on the behavior and possible ecotoxicological and
and occurrence in the aqueous environment, toxicological evaluation
human health risks of metformin and guanylurea in the water cycle.
is necessary to evaluate potential (environmental) risks.
4. General discussion and outlook
In the current study, the applied selection of pharmaceuticals for
monitoring was based on regional consumption data and their related
• The current study illustrates that national consumption data of phar-
emission to the sewer system on the basis of daily dose and human
maceuticals can be very helpful for the selection of relevant pharma-
excretion rate. It has been shown before that emissions of pharmaceu-
ceuticals for environmental monitoring.
ticals could be estimated on the basis of national consumption data
• Prediction of surface water concentrations can be improved when re-
(Richardson and Bowron, 1985; Siemens et al., 2008). However, region-
gional consumption data are used in combination with accurate data
al consumption data might provide more accurate predictions of influ-
of STPs, i.e. removal rates, conditions and treatment techniques ap-
ent concentrations when large discrepancies between regional and
national consumption of pharmaceuticals exist. This was for example
• Carbamazepine, hydrochlorothiazide, metoprolol and sotalol were sig-
observed for sotalol and irbesartan (see Table S2 of the Supplemental
nificantly better removed at higher wastewater temperatures.
Information). The regional consumption of sotalol and irbesartan in
• Carbamazepine, hydrochlorothiazide and sotalol were significantly
Ootmarsum exceeded national consumption with 40%. In this case the
better removed by conventional activated sludge systems with longer
predictions based on regional consumption were more accurate than
hydraulic retention times while metoprolol was significantly better
predictions based on national sales data would have been.
removed in a membrane bioreactor with a short hydraulic retention
For most studied pharmaceuticals in this study however, we found
low differences between national and regional consumption. National
• Metformin is readily biodegradable in activated sludge but is never-
consumption data can thus be a first tier in selecting relevant pharma-
theless detected at high concentrations in effluent and surface waters
ceuticals and sampling locations in monitoring programs but prediction
due to its high influent load. The high recovery of the biodegradation
of influent concentrations, based on regional consumption, can be more
product guanylurea illustrates that monitoring stable degradation
accurate when large discrepancies between regional and national con-
products can be relevant.
sumption of pharmaceuticals exist.
• Highest effluent loads of pharmaceuticals to the environment are
It should be noted that discrepancies between sales data and actual
expected at low sludge temperatures. Therefore a worst case study
consumption can exist due to delays between sales and actual use of
of emissions of pharmaceuticals into the environment should be car-
medication and temporal (seasonal) variations in pharmaceutical con-
ried out in winter.
sumption. This can bias consumption based predictions of influent con-centrations and emissions into the environment. In this study annualregional sales data of 2009 were compared to monitoring data in 2010.
Consumption patterns might have shifted to some extent, however,this difference is expected to be marginal for the selected pharmaceuti-
This work was funded by the water board Regge and Dinkel and
cals. Furthermore, incomplete medication compliance might have bi-
Agentschap NL. Supervision on data interpretation and literature re-
ased our predictions. The magnitude of medication compliance is
search was given within the joint research program of the Dutch drink-
largely unknown, however, Claxton et al. (2001) reported rather low
ing water companies (BTO). We thank local pharmacists for providing
medication compliance of β-blockers of 71%. Biases due to variations in
consumption data and human excretion rates and Pim de Voogt for con-
seasonal consumption and delay between sales and actual use are
structive comments to the manuscript.
expected to be less relevant since patients use all studied pharmaceuti-cals except diclofenac on a daily basis.
Regional sales data, human excretion rates, and STP removal rates
Appendix A. Supplementary data
can also be applied to predict emissions into the aquatic environment.
The removal of the pharmaceuticals in the studied STPs was generally
Supplementary data to this article can be found online at http://
comparable to literature data, so average removal rates, reported in
Author's personal copy
M. Oosterhuis et al. / Science of the Total Environment 442 (2013) 380–388
Ort C, Lawrence MG, Reungoat J, Eaglesham G, Carter S, Keller J. Determining the frac-
tion of pharmaceuticals residues in wastewater originating from a hospital. Water
Alder AC, Schaffner C, Majewsky M, Klasmeier J, Fenner K. Fate of β-blocker human
pharmaceuticals in surface water: comparison of measured and simulated concen-
Ort C, Lawrence MG, Rieckermann Jr, Joss A. Sampling for pharmaceuticals and personal
trations in the Glatt Valley Watershed, Switzerland. Water Res 2010;44:936–48.
care products (PPCPs) and illicit drugs in wastewater systems: are your conclusions
Batt AL, Kostich MS, Lazorchak JM. Analysis of ecologically relevant pharmaceuticals in waste-
valid? A critical review. Environ Sci Technol 2010b;44:6024–35.
water and surface water using selective solid-phase extraction and UPLC–MS/MS. Anal
Radjenovic J, Petrovic M, Barcelo D. Analysis of pharmaceuticals in wastewater and re-
moval using a membrane bioreactor. Anal Bioanal Chem 2007;387:1365–77.
Bruce GM, Pleus RC, Snyder SA. Toxicological relevance of pharmaceuticals in drinking
Radke M, Ulrich H, Wurm C, Kunkel U. Dynamics and attenuation of acidic pharmaceu-
water. Environ Sci Technol 2010;44:5619–26.
ticals along a river stretch. Environ Sci Technol 2010;44:2968–74.
Castiglioni S, Fanelli R, Calamari D, Bagnati R, Zuccato E. Methodological approaches for
Richardson, Bowron. J Pharm Pharmacol 1985;37(1):1-12.Zuccato, et al. Lancet 1985:
studying pharmaceuticals in the environment by comparing predicted and mea-
355-1789.Calamari. ES&T 1985;37:1241.
sured concentrations in River Po, Italy. Regul Toxicol Pharmacol 2004;39:25–32.
Roig B. Pharmaceuticals in the environment—current knowledge and need assessment
Claxton AJ, Cramer J, Pierce C. A systematic review of the associations between dose
to reduce presence and impact. London, UK: IWA; 2010. p. 198.
regimens and medication compliance. Clin Ther 2001. [23, NO. 8].
Rosal R, Rodriguez A, Perdigon-Melon JA, Petre A, Garcia-Calvo E, Gomez MJ, et al. Occurrence
Daughton CG, Ternes TA. Pharmaceuticals and personal care products in the environment:
of emerging pollutants in urban wastewater and their removal through biological treat-
agents of subtle change? Environ Health Perspect 1999;107:907–38.
ment followed by ozonation. Water Res 2010;44:578–88.
De Jongh CM, Kooij PJ, De Voogt P, Ter Laak TL. Screening and human health risk assessment
Ruhoy IS, Daughton CG. Beyond the medicine cabinet: an analysis of where and why
of pharmaceuticals and their transformation products in Dutch surface waters and drink-
medications accumulate. Environ Int 2008;34:1157–69.
ing water. Sci Total Environ 2012;427–428:70–7.
Sacher F, Ehmann M, Gabriel S, Graf C, Brauch HJ. Pharmaceutical residues in the river Rhine—
de Voogt P, Janex-Habibi M-L, Sacher F, Puijker LM, Mons M. Development of a common pri-
results of a one-decade monitoring programme. J Environ Monit 2008;10:664–70.
ority list of pharmaceuticals relevant for the water cycle. Water Sci Technol 2009;59:
Sanderson H. Presence and risk assessment of pharmaceuticals in surface water and
drinking water. Water Sci Technol 2011;63:2143–8.
Derksen JGM, Roorda JH, Swart D. Verg(h)ulde pillen. Utrecht, the Netherlands: STOWA;
Scheurer M, Sacher F, Brauch H-J. Occurrence of the antidiabetic drug metformin in
2007. p. 58.
sewage and surface waters in Germany. J Environ Monit 2009;11:1608–13.
Fent K, Weston AA, Caminada D. Ecotoxicology of human pharmaceuticals. Aquat Toxicol
Scheurer M, Michel A, Brauch H-J, Ruck W, Sacher F. Occurrence and fate of the
antidiabetic drug metformin and its metabolite guanylurea in the environment and
Flyborg L, Bjorlenius B, Persson KM. Can treated municipal wastewater be reused after
during drinking water treatment. Water Res 2012;46:4790–802.
ozonation and nanofiltration? Results from a pilot study of pharmaceutical remov-
Siemens J, Huschek G, Siebe C, Kaupenjohann M. Concentrations and mobility of human
al in Henriksdal WWTP, Sweden. Water Sci Technol 2010;61:1113–20.
pharmaceuticals in the world's largest wastewater irrigation system, Mexico City-
Hörsing M, Ledin A, Grabic R, Fick J, Tysklind M, Jansen JLC, et al. Determination of sorption
Mezquital Valley. Water Res 2008;42(8–9):2124–34.
of seventy-five pharmaceuticals in sewage sludge. Water Res 2011;45:4470–82.
Singer AC, Howard BM, Johnson AC, Knowles CJ, Jackman S, Accinelli C, et al. Meeting
Huerta-Fontela M, Galceran MT, Ventura F. Occurrence and removal of pharmaceuticals
report: risk assessment of Tamiflu use under pandemic conditions. Environ Health
and hormones through drinking water treatment. Water Res 2011;45:1432–42.
Jones OAH, Voulvoulis N, Lester JN. Aquatic environmental assessment of the top 25
Tchobanoglous G, Burton FL, Stencel DH. Wastewater engineering: treatment and reuse.
English prescription pharmaceuticals. Water Res 2002;36:5013–22.
McGraw-Hill; 2003.
Kasprzyk-Hordern B, Dinsdale RM, Guwy AJ. Multi-residue method for the determination of
ter Laak TL, Van der Aa M, Stoks P, Houtman C, van Wezel AP. Relating environmental
basic/neutral pharmaceuticals and illicit drugs in surface water by solid-phase extraction
concentrations of pharmaceuticals to consumption: a mass balance approach for
and ultra performance liquid chromatography–positive electrospray ionisation tandem
the river Rhine. Environ Int 2010;36:403–9.
mass spectrometry. J Chromatogr A 2007;1161:132–45.
Trautwein C, Kümmerer K. Incomplete aerobic degradation of the antidiabetic drug Metfor-
Kasprzyk-Hordern B, Dinsdale RM, Guwy AJ. The occurrence of pharmaceuticals, personal
min and identification of the bacterial dead-end transformation product Guanylurea.
care products, endocrine disruptors and illicit drugs in surface water in South Wales,
UK. Water Res 2008;42:3498–518.
Van den Berg Jeths A, Van Batenburg-Eddes T. The Netherlands swallows differently.
Lienert J, Gudel K, Escher BI. Screening method for ecotoxicological hazard assessment
Regional variations in cost and usage of medicines. Pharm Weekbl 2003;138:840–4.
of 42 pharmaceuticals considering human metabolism and excretory routes. Envi-
van der Aa NGFM, Kommer GJ, van Montfoort JE, Versteegh JFM. Demographic projections
ron Sci Technol 2007;41:4471–8.
of future pharmaceutical consumption in the Netherlands. Water Sci Technol 2011:
Maurer M, Escher BI, Richle P, Schaffner C, Alder AC. Elimination of β-blockers in sew-
age treatment plants. Water Res 2007;41:1614–22.
Vergouwen L, Hehenkamp M, van Veldhuizen H, Breedveld R. Gebiedsstudie
Miege C, Choubert JM, Ribeiro L, Eusebe M, Coquery M. Removal efficiency of pharmaceu-
geneesmiddelen in de provincie Utrecht. H2O; 2011b. p. 23–5.
ticals and personal care products with varying wastewater treatment processes and
Vergouwen AA, Pieters BJ, Kools S. Inventarisatie van emissie van geneesmiddelen uit
operating conditions—conception of a database and first results. Water Sci Technol
zorginstellingen. Amersfoort, The Netherlands: ZORG, Deel C. STOWA; 2011a.
Vieno N, Tuhkanen T, Kronberg L. Elimination of pharmaceuticals in sewage treatment
Musson SE, Townsend TG. Pharmaceutical compound content of municipal solid waste.
plants in Finland. Water Res 2007;41:1001–12.
J Hazard Mater 2009;162:730–5.
OECD. The 2007 OECD list of high production volume chemicals. Brussels, Belgium:
Organisation for Economic Co-operation and Development; 2009. p. 104.
Source: http://www.groenegezondheid.nl/admin/myuploads/Media/predictionofpharmaoosterhuis2013.pdf
Mathematical models of bipolar disorder
Commun Nonlinear Sci Numer Simulat 14 (2009) 2897–2908 Contents lists available at Commun Nonlinear Sci Numer Simulat Mathematical models of bipolar disorder Darryl Daugherty a, Tairi Roque-Urrea a, John Urrea-Roque a, Jessica Troyer b, Stephen Wirkus c,*,Mason A. Porter d a Department of Mathematical Sciences, Binghamton University, Binghamton, NY 13902-6000, USAb L-3 Communications Corporation, Huntsville, AL 35806, USAc Mathematical and Natural Sciences Division, Arizona State University, Glendale, AZ 85306-4908, USAd Oxford Centre for Industrial and Applied Mathematics, Mathematical Institute, University of Oxford, OX1 3LB, UK
Microsoft word - pharmaceutics8
Bulletin of Pharmaceutical Research 2012;1(S):41 An Official Publication of Association of Pharmacy Professionals ISSN: 2249-6041 (Print); ISSN: 2249-9245 (Online) GASTRORETENTIVE TARGETING TECHNOLOGY FOR ERADICATION OF HELICOBACTER PYLORI INFECTION Rakesh Pahwa*, Lovely Chhabra, Arunima Nath, Vipin Kumar Dept. of Pharmaceutics, Institute of Pharmaceutical Sciences, Kurukshetra University, Kurukshetra, Haryana